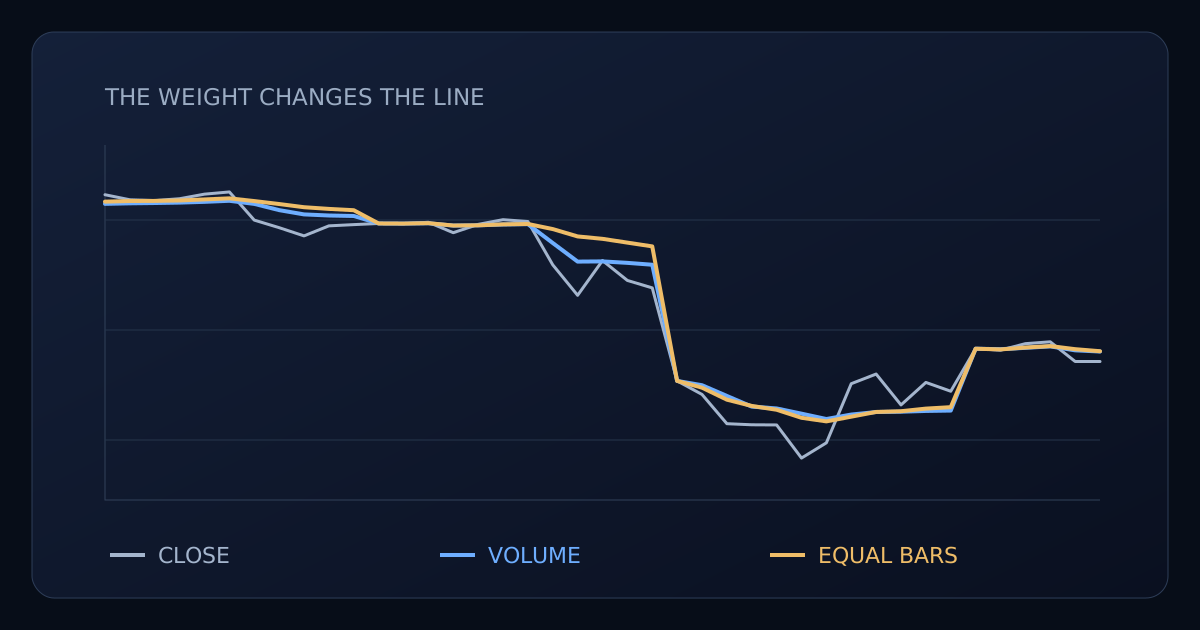
VWAP Indicator: Formula, Anchors, and What Tests Reveal
Learn how VWAP works, why its anchor and price source matter, and what matched historical tests reveal about volume weighting.
How common trading indicators work: formulas, signal rules, and what testing across many settings shows.
Learn how VWAP works, why its anchor and price source matter, and what matched historical tests reveal about volume weighting.
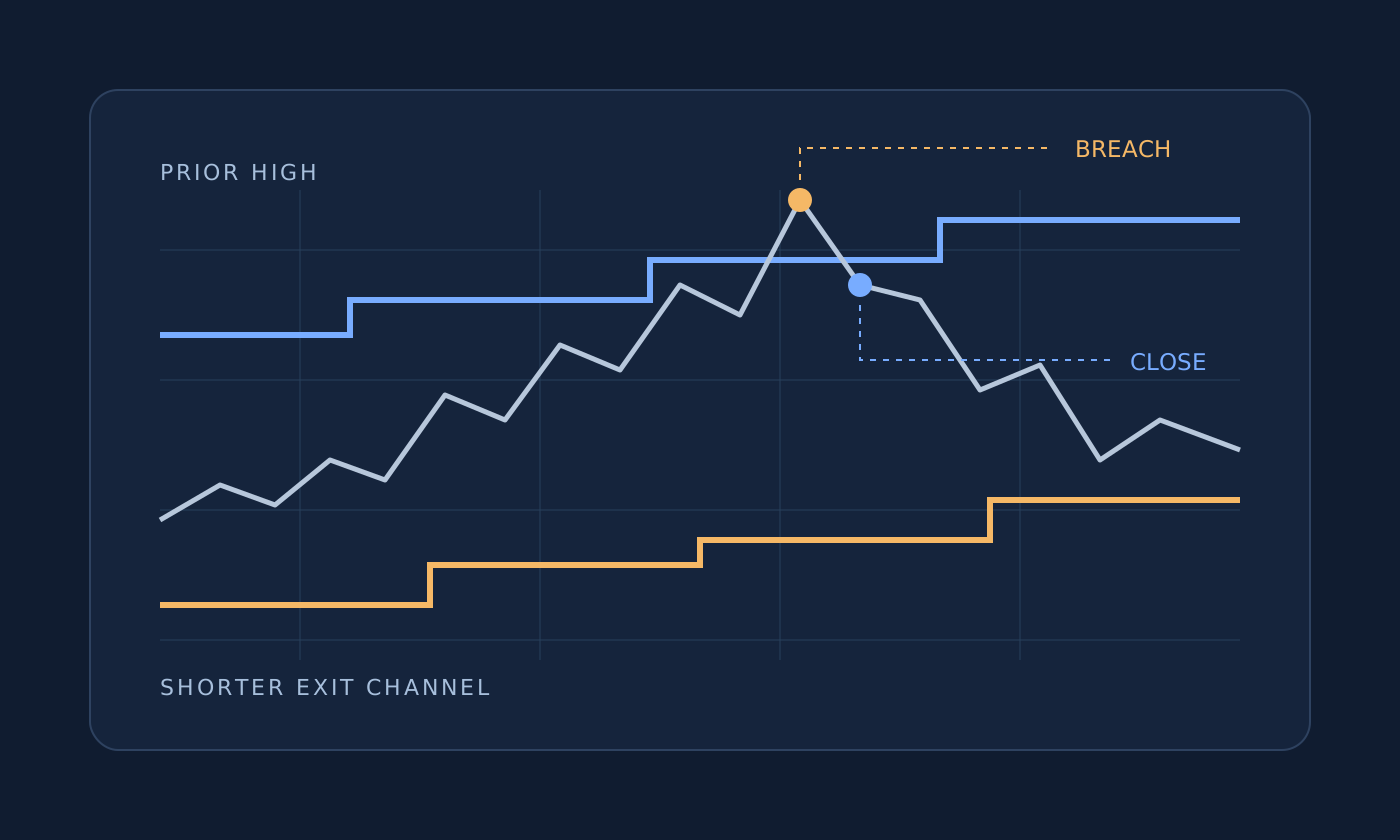
Learn the original Turtle trading rules, then explore why a stricter breakout entry sometimes produced more trades once a volatility exit changed the path.
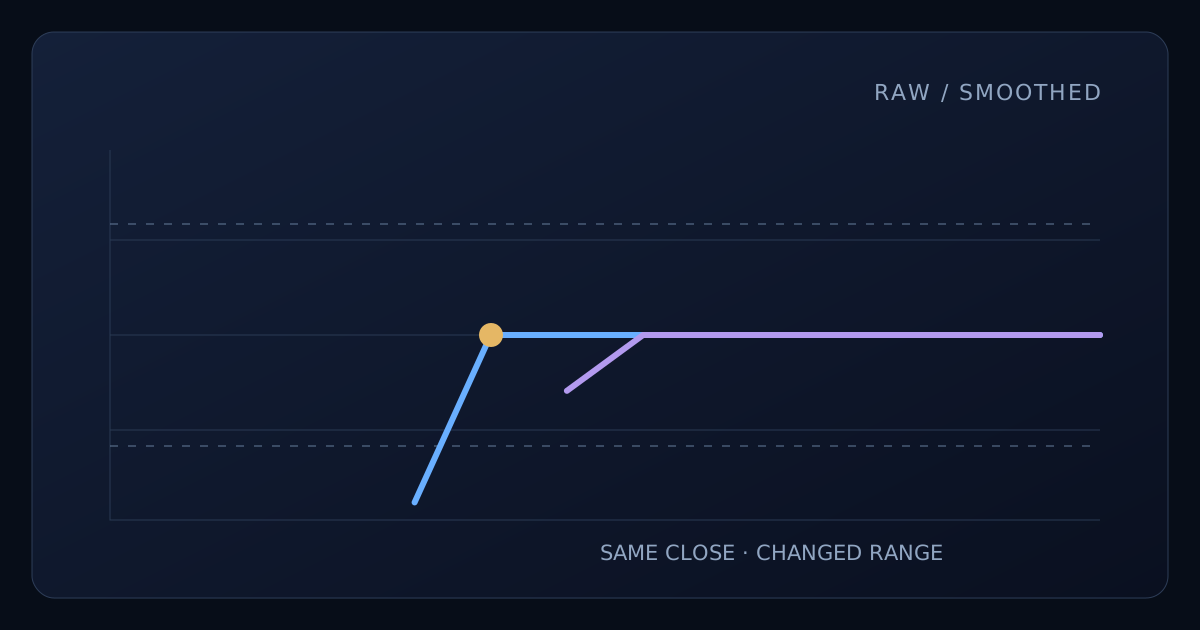
Understand stochastic %K and %D, fast and slow settings, and what extensive backtests reveal about smoothing and oversold signals.
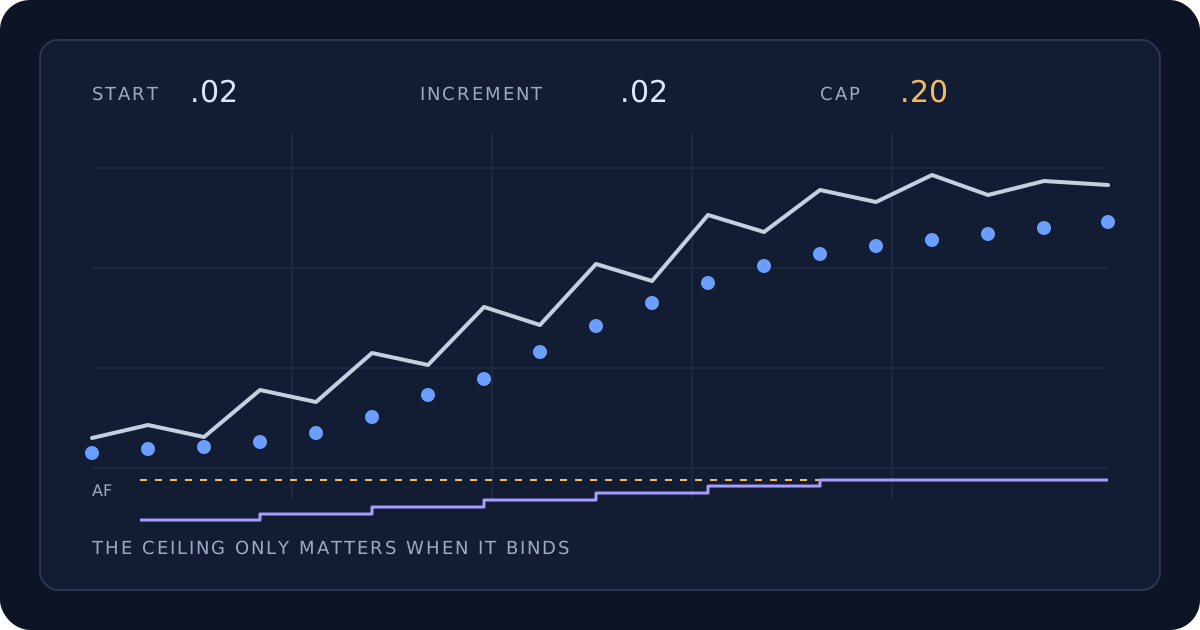
Learn Parabolic SAR settings and buy and sell signals, and why a higher acceleration cap can change timing without adding trades.
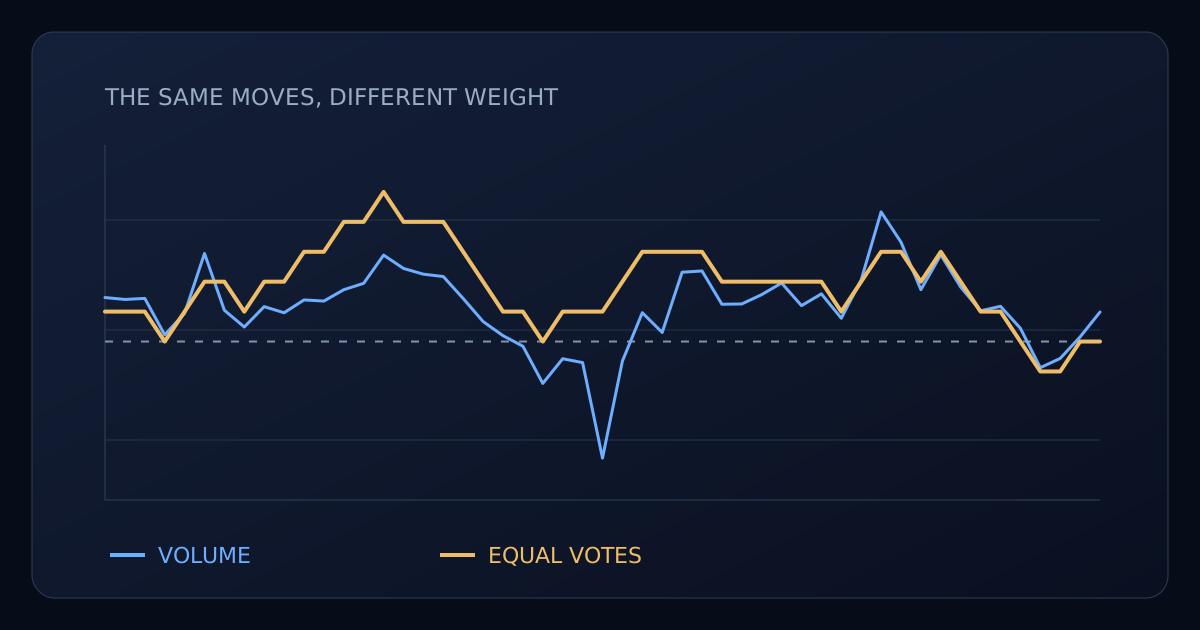
Learn the OBV formula, how to interpret divergence and trend confirmation, and what broad matched tests reveal about volume weighting.
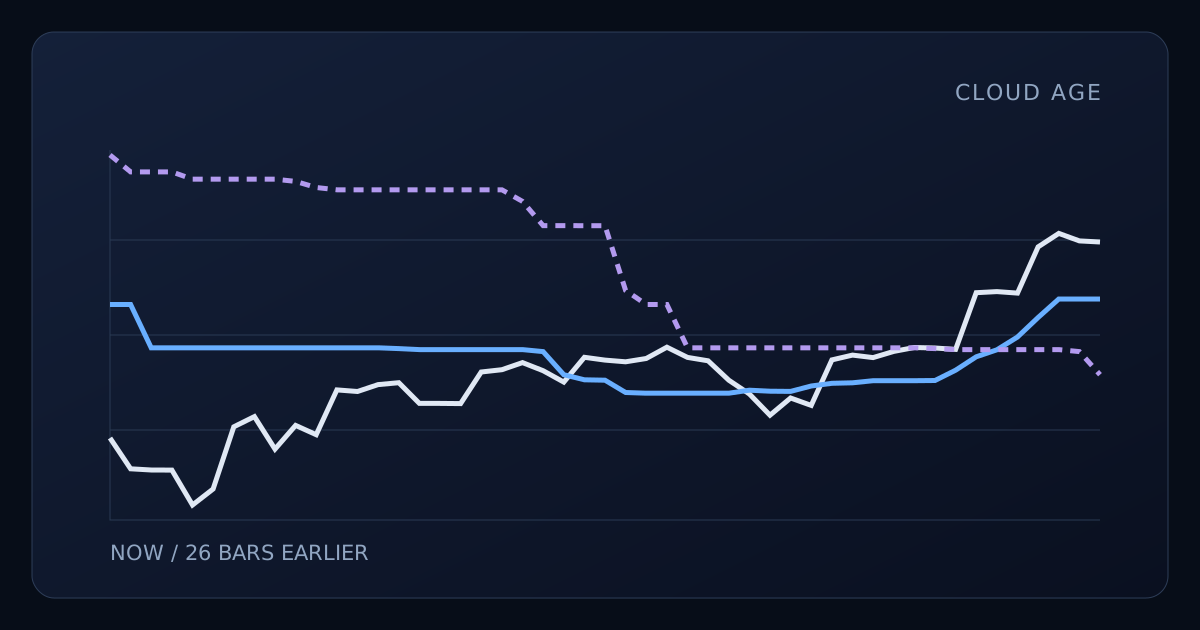
Understand Ichimoku's five lines, 9/26/52 settings, and how extensive tests reveal why cloud alignment changes trading signals.
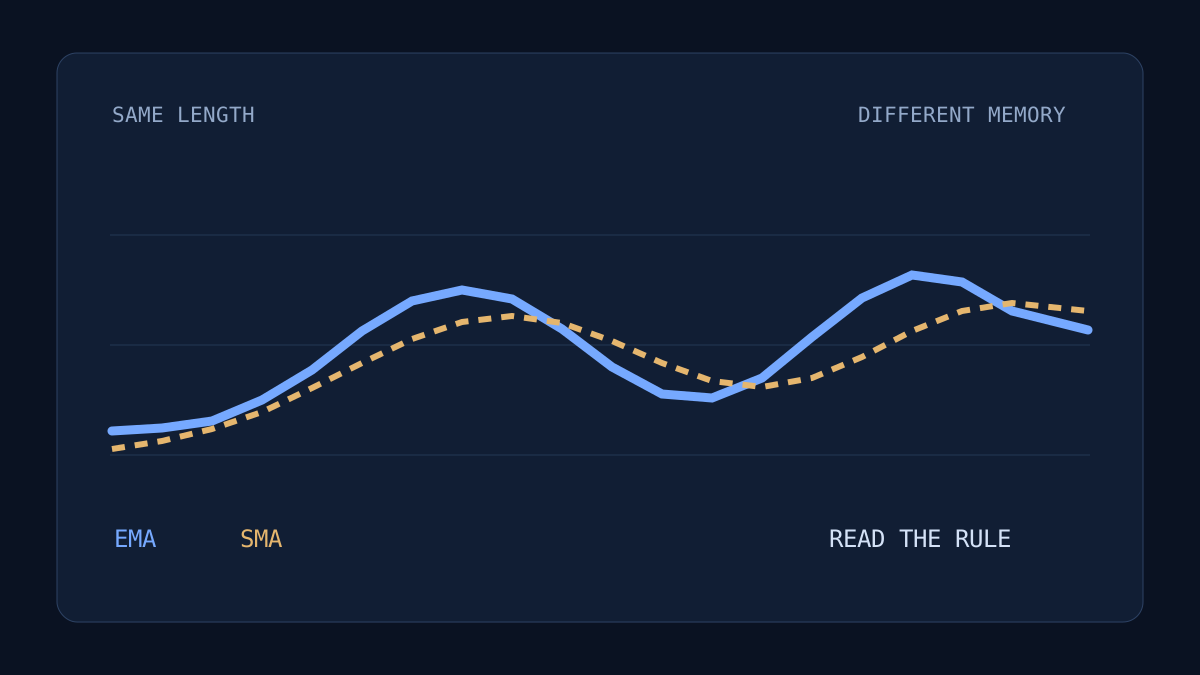
Learn how EMA weighting differs from SMA, why the period is not a fixed window, and how decision bands change the activity of a faster average.
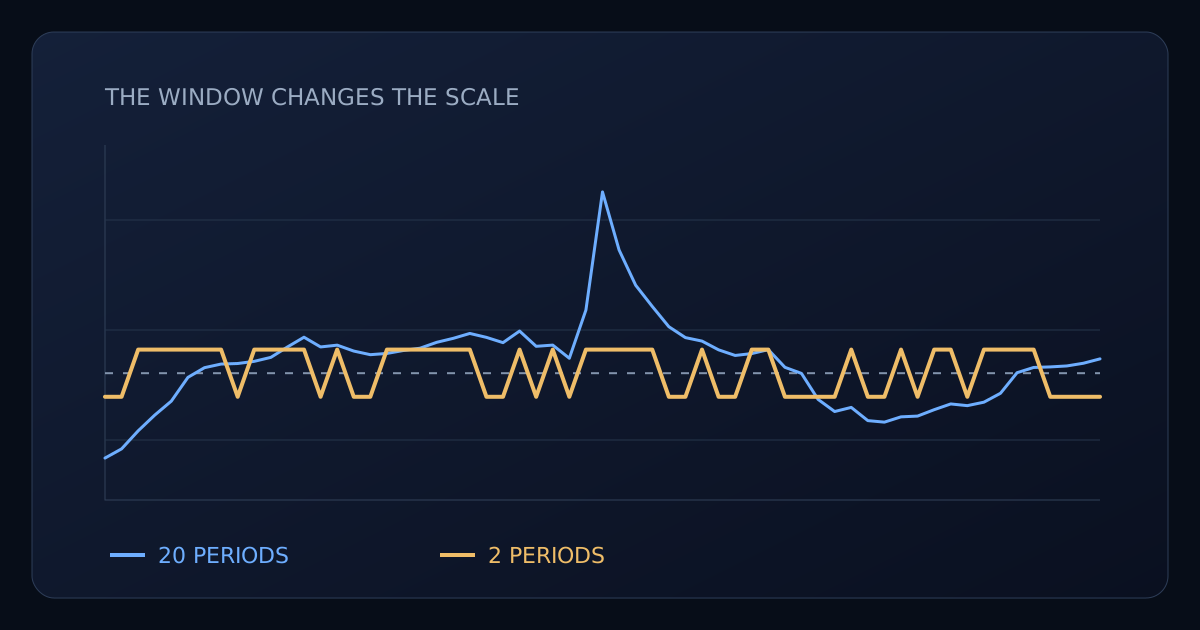
Understand the Commodity Channel Index formula, common thresholds, and why changing lookback changes a ±100 signal in broad historical tests.
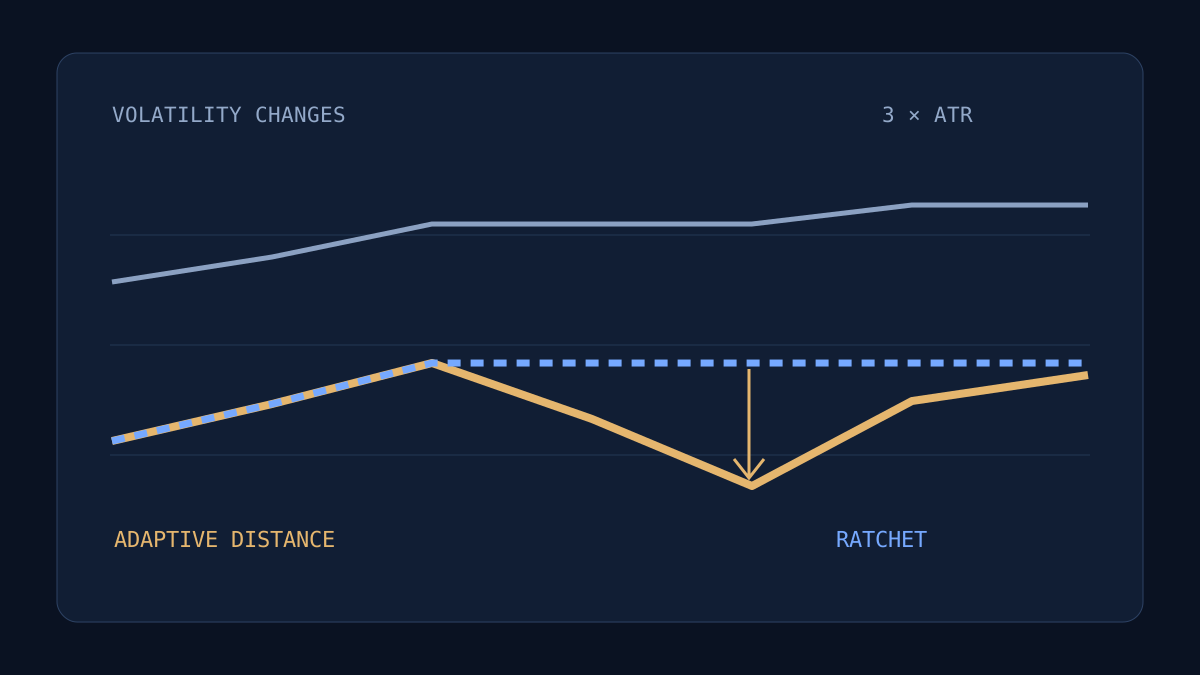
Learn the ATR formula, common 14-period setting, ATR percentage, and why recalculating an ATR trailing distance can loosen a stop unless it ratchets.
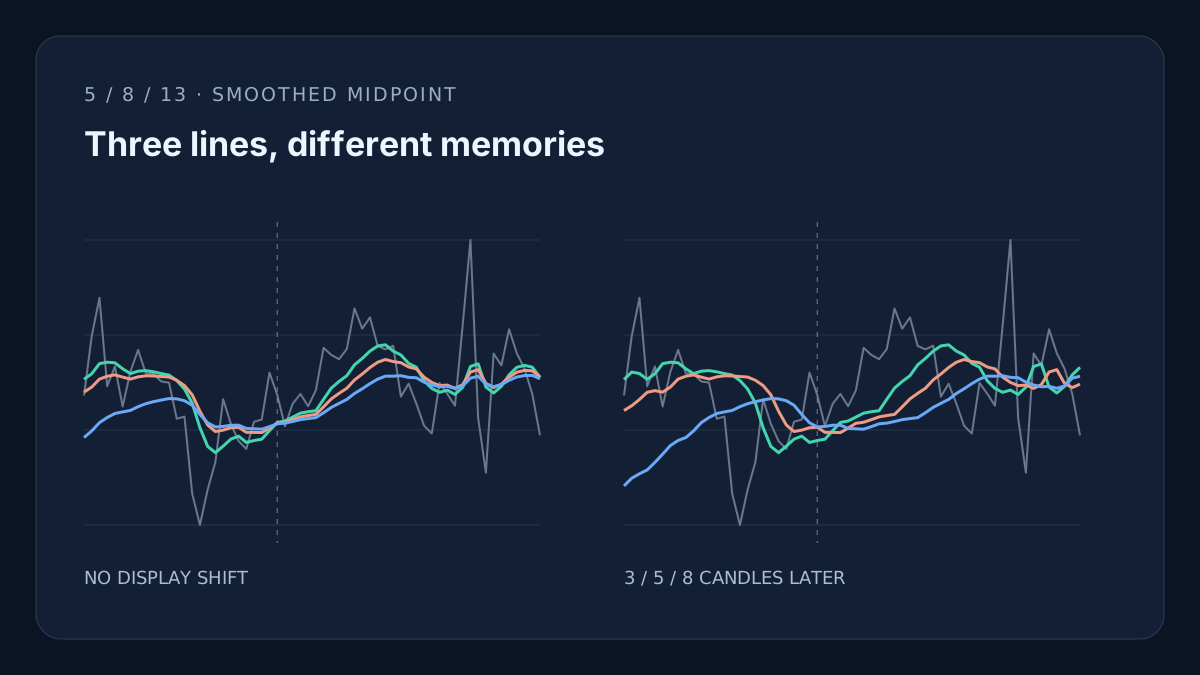
Learn Bill Williams' Alligator settings, trend signals, and fractal entries, with extensive backtests of the timing and exit choices behind the three lines.
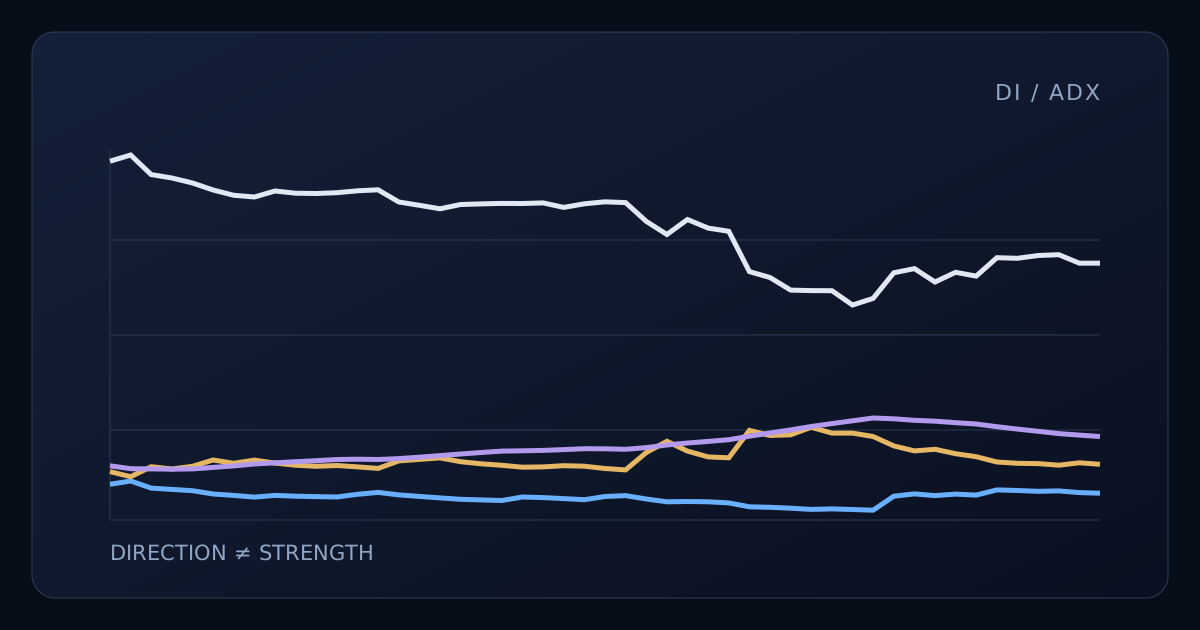
Learn how ADX and the DMI lines measure trend strength and direction, and what extensive tests reveal about smoothing and rising-ADX filters.
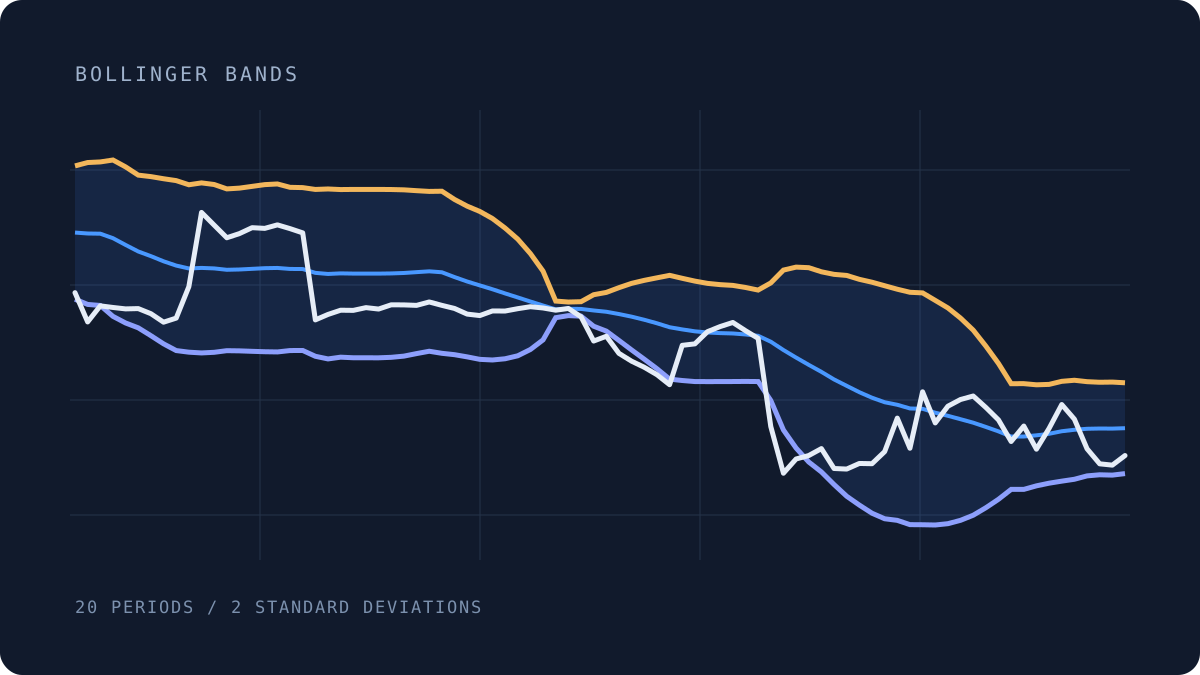
Learn the Bollinger Bands formula, common 20/2 settings, and how extensive tests reveal the interaction between lookback length, band width, and trading signals.
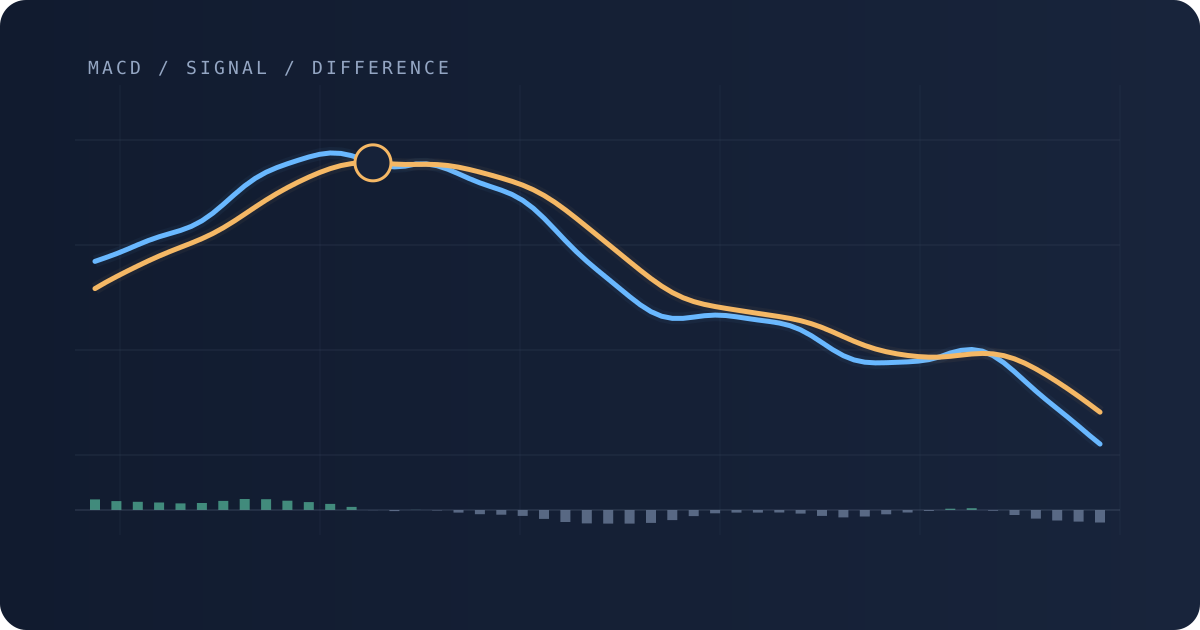
Learn the MACD formula and 12/26/9 settings, then see why a slower signal line can make a buffered trading rule busier.
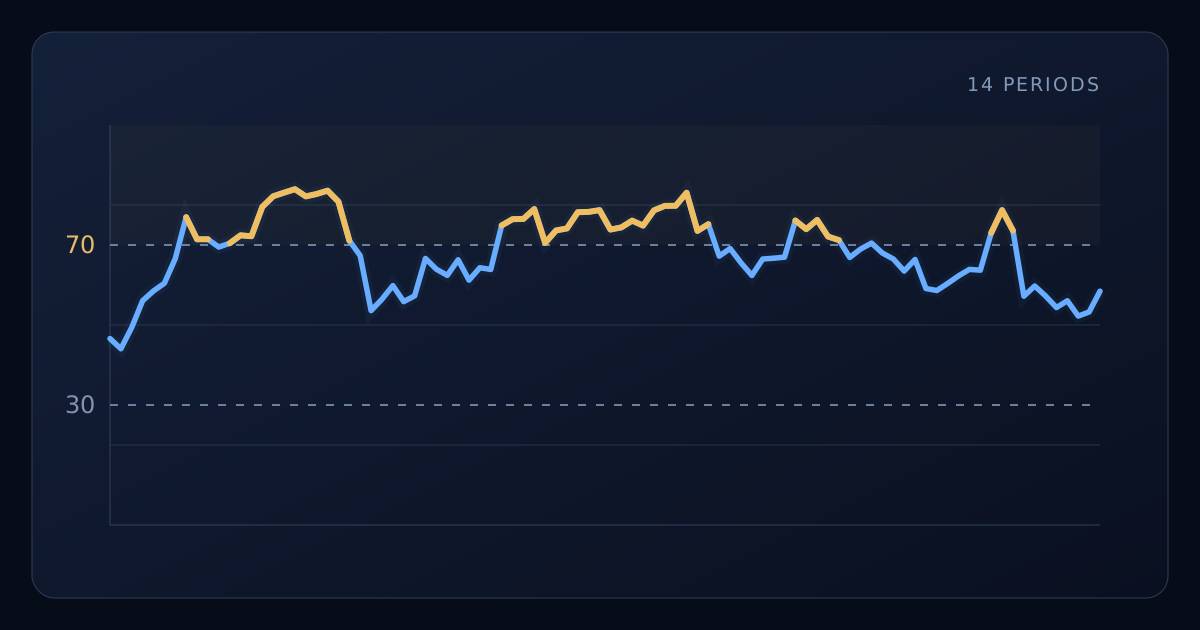
Learn the RSI formula, common 30/70 signals, and how its smoothing changes the meaning of overbought, recovery crossings, and trading activity.
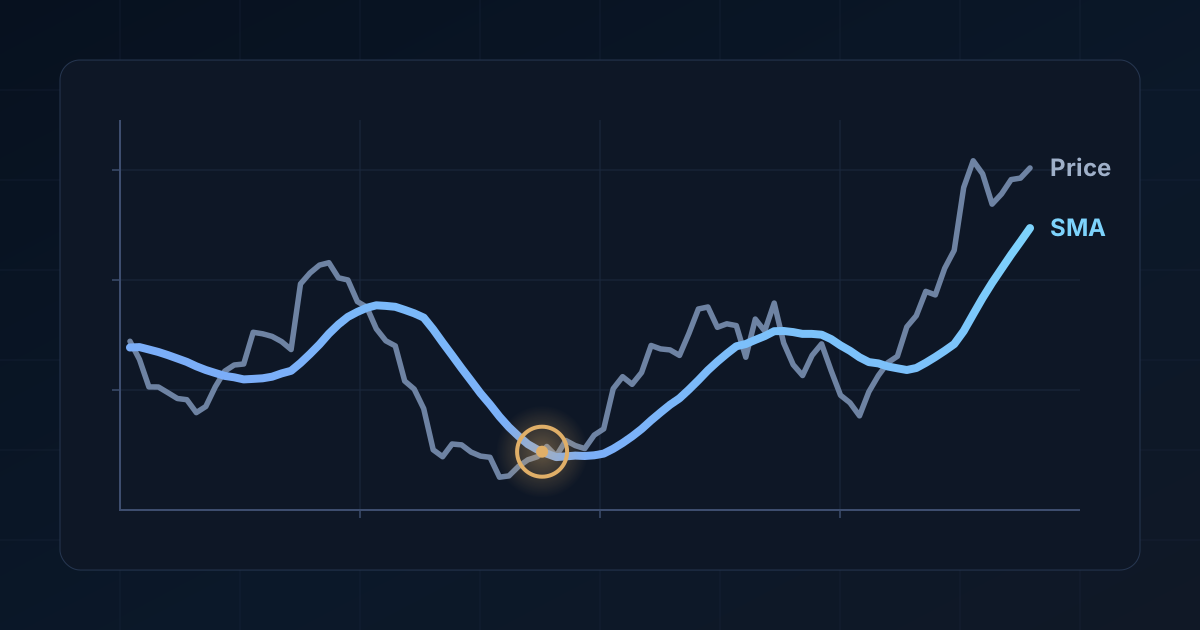
Learn the simple moving average formula, how traders use SMA signals, and what extensive testing reveals about smoothing, repeated crossings, and buffers.
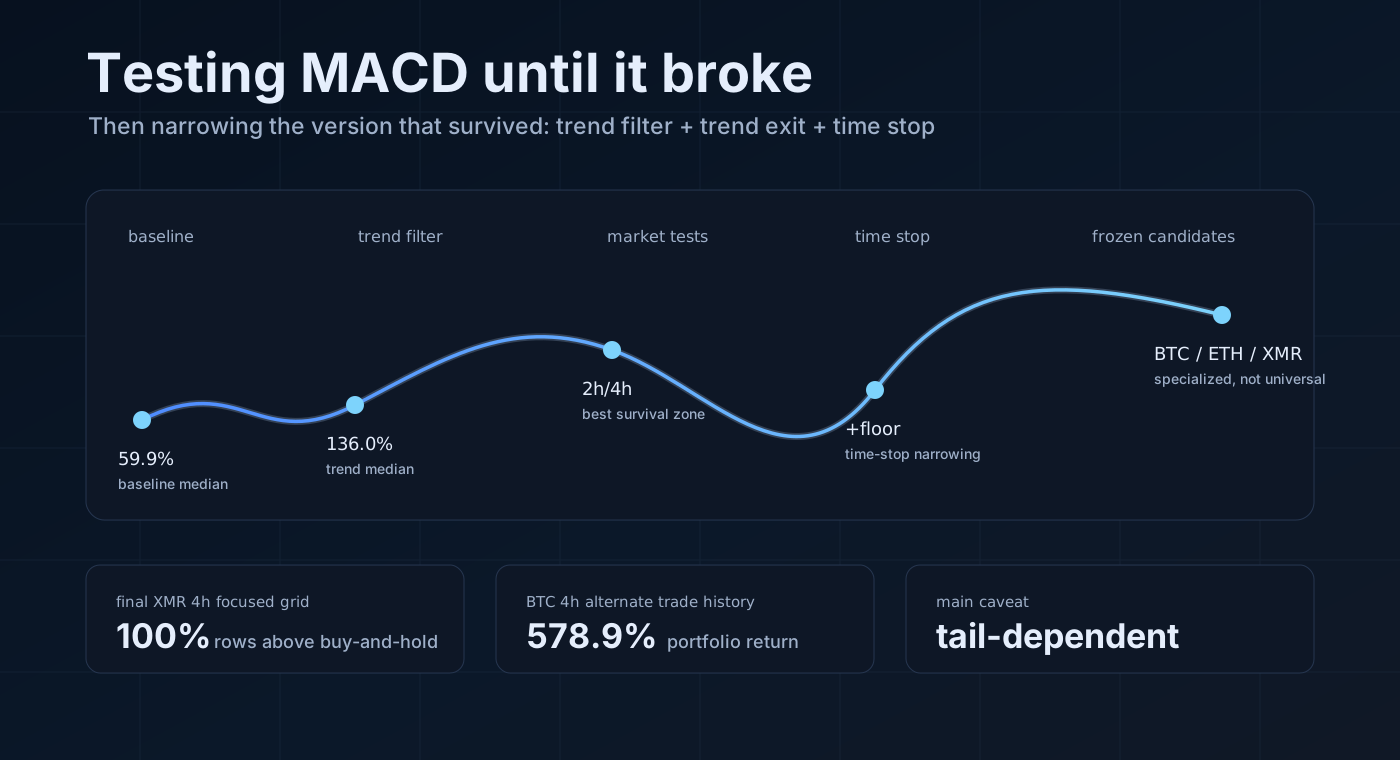
A technical research walk-through from a simple MACD crossover to a specialized trend-following strategy.