Key takeaways
- VWAP averages prices using volume weights and an explicit reset point; a daily VWAP and a rolling VWMA use different windows.
- On the first bar after a reset, close-source bar VWAP equals that close. With typical-price input, the above-or-below reading becomes a candle-midpoint comparison and volume cancels.
- Volume weighting can put the same close on a different side of the line. The historical tests compare that change with identical anchors and trading rules.
VWAP, short for Volume Weighted Average Price, is an average price that gives more weight to observations with more volume. Traders use it as an execution benchmark and a reference for reading the current price.
Our 19,392 configuration evaluations compare volume weighting, price sources, reset anchors, and simple trading rules. One useful distinction appears before any performance ranking: at the start of a new anchor, a candle-based VWAP may describe only that candle’s own price position. The volume has no influence until another observation joins it.
What does VWAP show?
A price above VWAP sits above the volume-weighted average since the chosen starting point. A price below it sits below that average. Neither relationship establishes where the next price will go.
Schwab’s explanation describes VWAP’s familiar intraday use. Execution benchmarking and a directional trading signal are different applications: buying below an average can improve an execution comparison while the market continues falling.
The anchor says when the calculation starts again. Session VWAP commonly resets each trading day. Other versions start at a week, a month, or a selected event. Changing that starting point changes which prices and volumes the line represents.
How to calculate VWAP
The underlying idea is:
VWAP = sum of price × volume since the anchor
       ÷ sum of volume since the anchor
Transaction-level VWAP can use individual trade prices and quantities. With candles, a common approximation supplies one price per candle, such as typical price = (high + low + close) / 3, and weights it by that candle’s volume. Our tests use this bar-based calculation and compare it with closing-price input.
For two observations priced at 100 and 110, volumes of 9 and 1 give a VWAP of 101. Equal weights give an average of 105. The observations are unchanged; their influence differs.
TradingView’s VWAP documentation explains the cumulative candle calculation, price-source setting, and reset choices. Source and anchor belong in a reproducible VWAP description.
Why the first bar needs a different interpretation
Immediately after a reset, the bar-based formula has only one observation. If its volume is positive:
First-bar VWAP = source price × volume ÷ volume
               = source price
With close as the source, VWAP equals the close. A strict close-above-VWAP rule cannot qualify on that first bar.
With typical price as the source, close above VWAP simplifies to:
close > (high + low + close) / 3

which is equivalent to

close > (high + low) / 2
The signal asks whether the candle closed above the midpoint of its high-low range. Volume cancels from both versions. This is an algebraic property of the one-observation candle approximation; it does not describe the average of every transaction inside that candle.
The script preserves the one-observation equality explicitly at each reset, preventing rounding from turning a tie into a strict above-or-below signal. Historical candle checks also reproduced the typical-price midpoint relation. An early reading can be useful, but its meaning changes as more observations accumulate.
Equality also matters for exits. A close-source rule that exits at or above VWAP can close on the first reset bar. A rule that requires the close to be strictly below VWAP does not qualify on that equality. The tests keep those definitions fixed.
Can volume weighting change a signal?
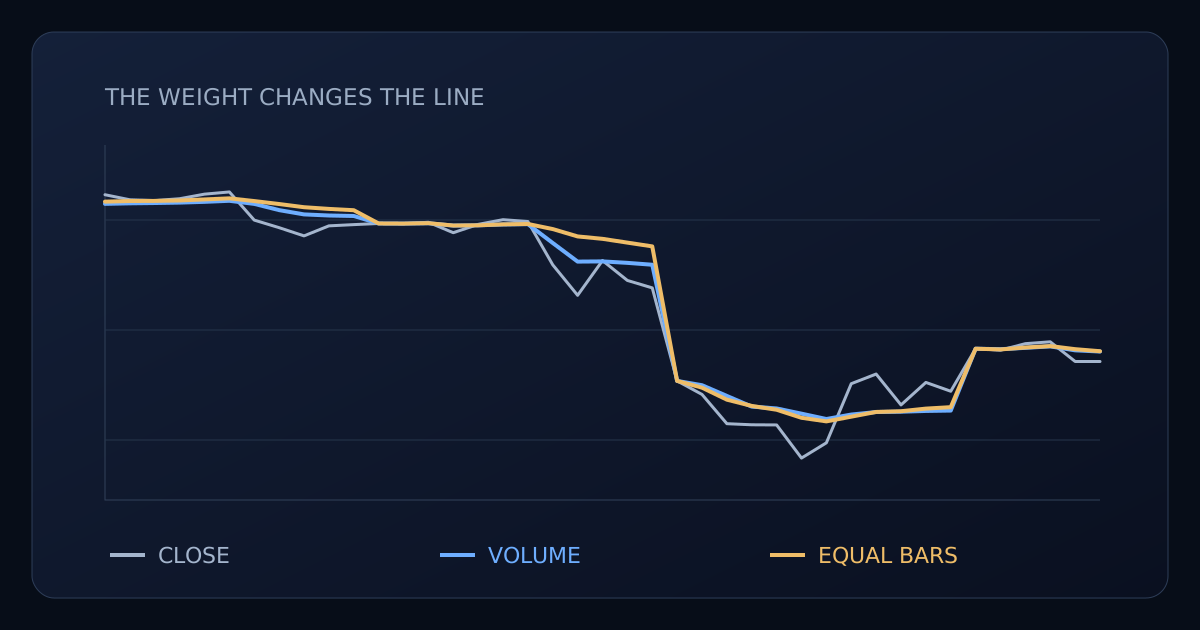
Yes. An equal-bar average and VWAP can place the same close on opposite sides of the line even when they share the same source and anchor.
A selected same-anchor example where volume weighting puts the close on the other side of the average.
The value table below is available without JavaScript.
Data and calculation details
Accessible value table (41 observations)
| Observation | Price and daily anchored averages · Close | Price and daily anchored averages · Volume weighting | Price and daily anchored averages · Equal bars |
|---|---|---|---|
| 2024-08-03T02:00:00Z | 61,895.990 | 61,530.474 | 61,619.000 |
| 2024-08-03T04:00:00Z | 61,693.990 | 61,551.549 | 61,643.997 |
| 2024-08-03T06:00:00Z | 61,662.010 | 61,563.506 | 61,648.500 |
| 2024-08-03T08:00:00Z | 61,735.990 | 61,580.684 | 61,665.998 |
| 2024-08-03T10:00:00Z | 61,919.380 | 61,610.985 | 61,708.228 |
| 2024-08-03T12:00:00Z | 62,007.990 | 61,652.894 | 61,751.051 |
| 2024-08-03T14:00:00Z | 60,879.000 | 61,528.470 | 61,642.045 |
| 2024-08-03T16:00:00Z | 60,576.000 | 61,278.562 | 61,523.596 |
| 2024-08-03T18:00:00Z | 60,246.000 | 61,107.293 | 61,395.836 |
| 2024-08-03T20:00:00Z | 60,648.000 | 61,063.263 | 61,327.851 |
| 2024-08-03T22:00:00Z | 60,697.990 | 61,043.759 | 61,275.362 |
| 2024-08-04T00:00:00Z | 60,743.580 | 60,743.580 | 60,743.580 |
| 2024-08-04T02:00:00Z | 60,735.000 | 60,738.987 | 60,739.290 |
| 2024-08-04T04:00:00Z | 60,792.000 | 60,752.640 | 60,756.860 |
| 2024-08-04T06:00:00Z | 60,373.990 | 60,659.216 | 60,661.143 |
| 2024-08-04T08:00:00Z | 60,708.000 | 60,669.494 | 60,670.514 |
| 2024-08-04T10:00:00Z | 60,896.000 | 60,703.042 | 60,708.095 |
| 2024-08-04T12:00:00Z | 60,822.010 | 60,716.962 | 60,724.369 |
| 2024-08-04T14:00:00Z | 59,086.010 | 59,960.878 | 60,519.574 |
| 2024-08-04T16:00:00Z | 57,864.430 | 59,215.576 | 60,224.558 |
| 2024-08-04T18:00:00Z | 59,257.660 | 59,223.668 | 60,127.868 |
| 2024-08-04T20:00:00Z | 58,459.980 | 59,164.864 | 59,976.242 |
| 2024-08-04T22:00:00Z | 58,161.000 | 59,089.506 | 59,824.972 |
| 2024-08-05T00:00:00Z | 54,432.650 | 54,432.650 | 54,432.650 |
| 2024-08-05T02:00:00Z | 53,890.870 | 54,260.561 | 54,161.760 |
| 2024-08-05T04:00:00Z | 52,718.000 | 53,829.984 | 53,680.507 |
| 2024-08-05T06:00:00Z | 52,674.190 | 53,402.784 | 53,428.928 |
| 2024-08-05T08:00:00Z | 52,667.800 | 53,329.245 | 53,276.702 |
| 2024-08-05T10:00:00Z | 51,340.000 | 53,120.091 | 52,953.918 |
| 2024-08-05T12:00:00Z | 51,951.000 | 52,905.255 | 52,810.644 |
| 2024-08-05T14:00:00Z | 54,321.090 | 53,084.446 | 52,999.450 |
| 2024-08-05T16:00:00Z | 54,707.990 | 53,185.566 | 53,189.288 |
| 2024-08-05T18:00:00Z | 53,470.090 | 53,198.577 | 53,217.368 |
| 2024-08-05T20:00:00Z | 54,372.010 | 53,228.791 | 53,322.335 |
| 2024-08-05T22:00:00Z | 54,018.810 | 53,244.350 | 53,380.375 |
| 2024-08-06T00:00:00Z | 55,723.980 | 55,723.980 | 55,723.980 |
| 2024-08-06T02:00:00Z | 55,665.730 | 55,704.293 | 55,694.855 |
| 2024-08-06T04:00:00Z | 55,925.970 | 55,757.953 | 55,771.893 |
| 2024-08-06T06:00:00Z | 55,999.990 | 55,816.017 | 55,828.917 |
| 2024-08-06T08:00:00Z | 55,211.990 | 55,658.659 | 55,705.532 |
| 2024-08-06T10:00:00Z | 55,210.010 | 55,610.550 | 55,622.945 |
Select Same close, different side. Both averages reset together. Higher-volume observations pull the blue line more strongly, while every observation has equal influence on the amber line.
This selected episode illustrates the calculation. With daily anchors and closing-price input, strict opposite price-to-average signs appeared on about 1.8–3.2% of checked candles across the historical samples. Volume can change the reading even when the anchor and prices stay fixed. That frequency does not establish which line provides a better future forecast.
How anchors and buffers change trading activity
We tested two explicit rules. A strength rule buys above an average plus a buffer and exits below the average. A fade rule buys below the average minus a buffer and exits at or above it.
Additional tests using small positions hold the source, weekly anchor, and strength rule fixed. Each point in the next chart changes only the required percentage distance from the average.
One fixed rule and historical sample, changing only the displayed setting and line comparison. Each buy/sell is one execution.
The value table below is available without JavaScript.
Data and calculation details
Accessible value table (101 observations)
| Observation | Executions by entry buffer (%) · Volume weighting | Executions by entry buffer (%) · Equal bars |
|---|---|---|
| 0.0 | 1,244.000 | 1,248.000 |
| 0.05 | 1,162.000 | 1,164.000 |
| 0.1 | 1,070.000 | 1,094.000 |
| 0.15 | 1,008.000 | 1,004.000 |
| 0.2 | 950.000 | 930.000 |
| 0.25 | 896.000 | 870.000 |
| 0.3 | 840.000 | 830.000 |
| 0.35 | 784.000 | 790.000 |
| 0.4 | 758.000 | 746.000 |
| 0.45 | 722.000 | 706.000 |
| 0.5 | 704.000 | 674.000 |
| 0.55 | 672.000 | 652.000 |
| 0.6 | 644.000 | 632.000 |
| 0.65 | 616.000 | 612.000 |
| 0.7 | 602.000 | 590.000 |
| 0.75 | 590.000 | 568.000 |
| 0.8 | 584.000 | 556.000 |
| 0.85 | 568.000 | 546.000 |
| 0.9 | 554.000 | 538.000 |
| 0.95 | 540.000 | 526.000 |
| 1.0 | 522.000 | 510.000 |
| 1.05 | 514.000 | 506.000 |
| 1.1 | 502.000 | 488.000 |
| 1.15 | 490.000 | 476.000 |
| 1.2 | 476.000 | 466.000 |
| 1.25 | 466.000 | 458.000 |
| 1.3 | 450.000 | 446.000 |
| 1.35 | 438.000 | 436.000 |
| 1.4 | 430.000 | 424.000 |
| 1.45 | 424.000 | 418.000 |
| 1.5 | 414.000 | 404.000 |
| 1.55 | 400.000 | 400.000 |
| 1.6 | 396.000 | 390.000 |
| 1.65 | 388.000 | 370.000 |
| 1.7 | 374.000 | 364.000 |
| 1.75 | 360.000 | 360.000 |
| 1.8 | 352.000 | 350.000 |
| 1.85 | 346.000 | 342.000 |
| 1.9 | 340.000 | 334.000 |
| 1.95 | 334.000 | 328.000 |
| 2.0 | 320.000 | 322.000 |
| 2.05 | 310.000 | 316.000 |
| 2.1 | 306.000 | 312.000 |
| 2.15 | 296.000 | 306.000 |
| 2.2 | 294.000 | 292.000 |
| 2.25 | 290.000 | 280.000 |
| 2.3 | 284.000 | 268.000 |
| 2.35 | 282.000 | 264.000 |
| 2.4 | 274.000 | 262.000 |
| 2.45 | 266.000 | 258.000 |
| 2.5 | 260.000 | 256.000 |
| 2.55 | 258.000 | 250.000 |
| 2.6 | 254.000 | 250.000 |
| 2.65 | 250.000 | 250.000 |
| 2.7 | 246.000 | 244.000 |
| 2.75 | 240.000 | 240.000 |
| 2.8 | 234.000 | 238.000 |
| 2.85 | 228.000 | 232.000 |
| 2.9 | 226.000 | 232.000 |
| 2.95 | 226.000 | 230.000 |
| 3.0 | 222.000 | 226.000 |
| 3.05 | 218.000 | 224.000 |
| 3.1 | 210.000 | 222.000 |
| 3.15 | 208.000 | 220.000 |
| 3.2 | 204.000 | 218.000 |
| 3.25 | 202.000 | 218.000 |
| 3.3 | 194.000 | 216.000 |
| 3.35 | 192.000 | 206.000 |
| 3.4 | 186.000 | 204.000 |
| 3.45 | 184.000 | 194.000 |
| 3.5 | 180.000 | 190.000 |
| 3.55 | 176.000 | 182.000 |
| 3.6 | 174.000 | 182.000 |
| 3.65 | 168.000 | 174.000 |
| 3.7 | 168.000 | 170.000 |
| 3.75 | 160.000 | 168.000 |
| 3.8 | 156.000 | 168.000 |
| 3.85 | 152.000 | 168.000 |
| 3.9 | 148.000 | 164.000 |
| 3.95 | 142.000 | 160.000 |
| 4.0 | 142.000 | 154.000 |
| 4.05 | 138.000 | 152.000 |
| 4.1 | 138.000 | 144.000 |
| 4.15 | 132.000 | 144.000 |
| 4.2 | 128.000 | 142.000 |
| 4.25 | 126.000 | 142.000 |
| 4.3 | 126.000 | 138.000 |
| 4.35 | 126.000 | 132.000 |
| 4.4 | 124.000 | 130.000 |
| 4.45 | 122.000 | 130.000 |
| 4.5 | 122.000 | 124.000 |
| 4.55 | 118.000 | 124.000 |
| 4.6 | 112.000 | 120.000 |
| 4.65 | 106.000 | 118.000 |
| 4.7 | 100.000 | 116.000 |
| 4.75 | 100.000 | 114.000 |
| 4.8 | 98.000 | 114.000 |
| 4.85 | 96.000 | 112.000 |
| 4.9 | 94.000 | 112.000 |
| 4.95 | 94.000 | 110.000 |
| 5.0 | 94.000 | 100.000 |
The direction of the weighting difference also changes with the threshold. In the illustrated sample, a 0.50% buffer recorded 704 executions with volume weights and 674 with equal bars. At a 2% buffer, the counts were 320 and 322.
A wider buffer changes which entries qualify, when a position starts, and which later signals arrive while that position is open. Execution counts describe the resulting strategy path, not every candle above the line.
Daily and monthly anchors represent different amounts of history. Calling one a better VWAP setting would conceal that change in the question. The complete fixed-grid comparisons, including returns, drawdowns, and inactive settings, remain in the evidence.
VWAP versus VWMA, and useful settings
VWMA, a volume-weighted moving average, normally uses a rolling number of bars. Its oldest observation leaves whenever a new one arrives. Anchored VWAP keeps accumulating until its reset. A 20-bar VWMA and a daily VWAP can therefore contain different observations even on the same chart.
Choose a timeframe with enough observations inside the anchor to answer the intended question. A session anchor on daily candles leaves one candle per session; the bar approximation then collapses to its source every bar. Our relatively coarse intraday tests answer questions about those candles, not minute-by-minute execution quality.
There is no universal best source, anchor, or buffer. A useful comparison holds two of them fixed and changes the third, then repeats the same rule on another historical sample.
Reproduce the comparison
The script defaults to daily anchors, closing-price input, volume weighting, and an unbuffered strength rule. Switch the weight to equal bars to isolate the effect of volume.
//@version=6
strategy("VWAP Lab: anchors, weighting and buffers", overlay=true, initial_capital=10000, default_qty_type=strategy.percent_of_equity, default_qty_value=99, process_orders_on_close=false)

anchor_mode = input.int(0, "UTC anchor: 0 day, 1 week, 2 month", minval=0, maxval=2)
source_mode = input.int(0, "Source: 0 close, 1 typical price", minval=0, maxval=1)
weight_mode = input.int(0, "Weight: 0 volume, 1 equal bars", minval=0, maxval=1)
rule_mode = input.int(0, "Rule: 0 strength, 1 fade", minval=0, maxval=1)
buffer_pct = input.float(0.0, "Entry buffer percent", minval=0.0, maxval=5.0)

source_value = source_mode == 0 ? close : hlc3
day_reset = timeframe.change("1D")
week_reset = timeframe.change("1W")
month_reset = timeframe.change("1M")
is_reset = bar_index == 0 or (anchor_mode == 0 ? day_reset : anchor_mode == 1 ? week_reset : month_reset)
bar_weight = weight_mode == 0 ? volume : 1.0
var float weighted_total = 0.0
var float weight_total = 0.0
weighted_total := is_reset ? source_value * bar_weight : weighted_total + source_value * bar_weight
weight_total := is_reset ? bar_weight : weight_total + bar_weight
// Preserve the one-observation identity exactly at each reset.
anchor_mean = weight_total > 0 ? (is_reset ? source_value : weighted_total / weight_total) : na
ready = bar_index >= 500 and not na(anchor_mean)
entry_level = anchor_mean * (1.0 + (rule_mode == 0 ? buffer_pct : -buffer_pct) / 100.0)
enter_long = ready and (rule_mode == 0 ? close > entry_level : close < entry_level)
exit_long = ready and (rule_mode == 0 ? close < anchor_mean : close >= anchor_mean)

plot(anchor_mean, "Anchored average", color=color.blue)
plot(entry_level, "Entry boundary", color=color.orange)
if exit_long and strategy.position_size > 0
    strategy.close("Long")
if enter_long and not exit_long and strategy.position_size == 0
    strategy.entry("Long", strategy.long)
Markets, settings, accounting, and reproducibility
The study used Binance Spot BTCUSDT and ETHUSDT, two-hour and four-hour candles, and the historical windows 2021-01-01–2023-12-31 and 2024-01-01–2025-12-31. These eight frames share a frozen grid; the later window is retrospective replication, not a blind holdout.
Final VWAP main sweeps and activity controls were run through TrainBard’s web interface. Completed UI totals, parameter membership, source checksums, settings snapshots, and original exports are reconciled before inclusion. Omitted zero-trade tuples remain valid tested configurations; their execution count is zero, while absent return, drawdown, fee, and win-rate cells are left absent. Shared interface bridge checks and all superseded reset implementations are outside these counts. The completed UI exported 19,380 metric rows and omitted 12 zero-trade tuples: the BTCUSDT four-hour later-window daily, close-source, volume-weighted fade rule at buffers 4.45–5.00%. All 19,392 remain accepted evaluations; return and drawdown summaries describe the 19,380 observed metric rows.
Each frame contains 2,424 configurations: three UTC reset anchors (day, Monday-based week, calendar month), two price sources (close or hlc3), two weightings (volume or one vote per bar), two rules, and 101 percentage buffers from 0 through 5 in steps of 0.05. The main count is 19,392 accepted configurations. Diagnostic runs are excluded. 1,616 additional fixed small-notional evaluations repeat the complete activity curves across the same eight frames. In those controls, each entry requests qty = 100 / signal close; actual next-open fill notional can differ. Their smaller requested size separates the displayed activity comparison from the broad sweeps’ equity-funding behavior. The exact activity-control script is retained separately; these confirmations are excluded from the main count.
When cumulative weight is zero, the volume-weighted line is unavailable. At a positive-weight reset, the script assigns its source exactly; that equality is an implementation of the formula, not independent evidence from the backtests. Earlier unguarded reset versions are retained as excluded diagnostics.
A daily anchor contains twelve two-hour candles or six four-hour candles in a complete UTC day. These are crypto calendar anchors, not an equity exchange’s opening session. The selected end date includes its 00:00 UTC candle open, rather than the whole final calendar day.
Signals are evaluated on completed candles and request next-open market execution. Each test starts with 10,000 USDT, remains in cash for 500 startup bars, requests 99% equity sizing, and uses the platform’s 0.1% combined fee/slippage setting per execution. The declaration does not guarantee a persistent 1% cash reserve under the returned fee and fill model. Idle cash has no yield and no leverage is used. Remaining positions are valued at the endpoint. The same 500-bar startup spans different elapsed time on the two candle sizes.
A buy and a sell each count as one execution. The platform’s totalTrades field is reported on that basis. Return and drawdown summaries use returned platform metrics; they are conditional on those execution assumptions. The shared execution and source audit records passive controls, sizing checks, fees, and data comparisons.
Historical calculations use exact TrainBard-returned candles. An official-archive crosscheck found small differences in the earlier window, preserved in the source audit. The later-window candle values used in the teaching chart matched the official archive crosscheck.
The weighting chart selects a BTCUSDT two-hour later-window bar with opposite close-to-average signs and the largest relative separation between its daily volume-weighted and equal-bar means. Its values are local indicator calculations, not recorded fills. The activity chart uses the fixed small-notional controls and shows the BTCUSDT two-hour early-window, weekly-anchor, close-source strength comparison. Exact settings and complete frame mappings remain in the chart downloads.
The study evidence contains run identifiers, accepted counts, grid definitions, checksums, per-frame summaries, and direct candle measurements. The tested script accompanies it. Original sanitized requests, full exports, and diagnostic versions remain in the research archive.
Related configurations share prices and many decisions. Counts document the search coverage and replication; they do not measure independent statistical evidence or establish an edge in an untested market.
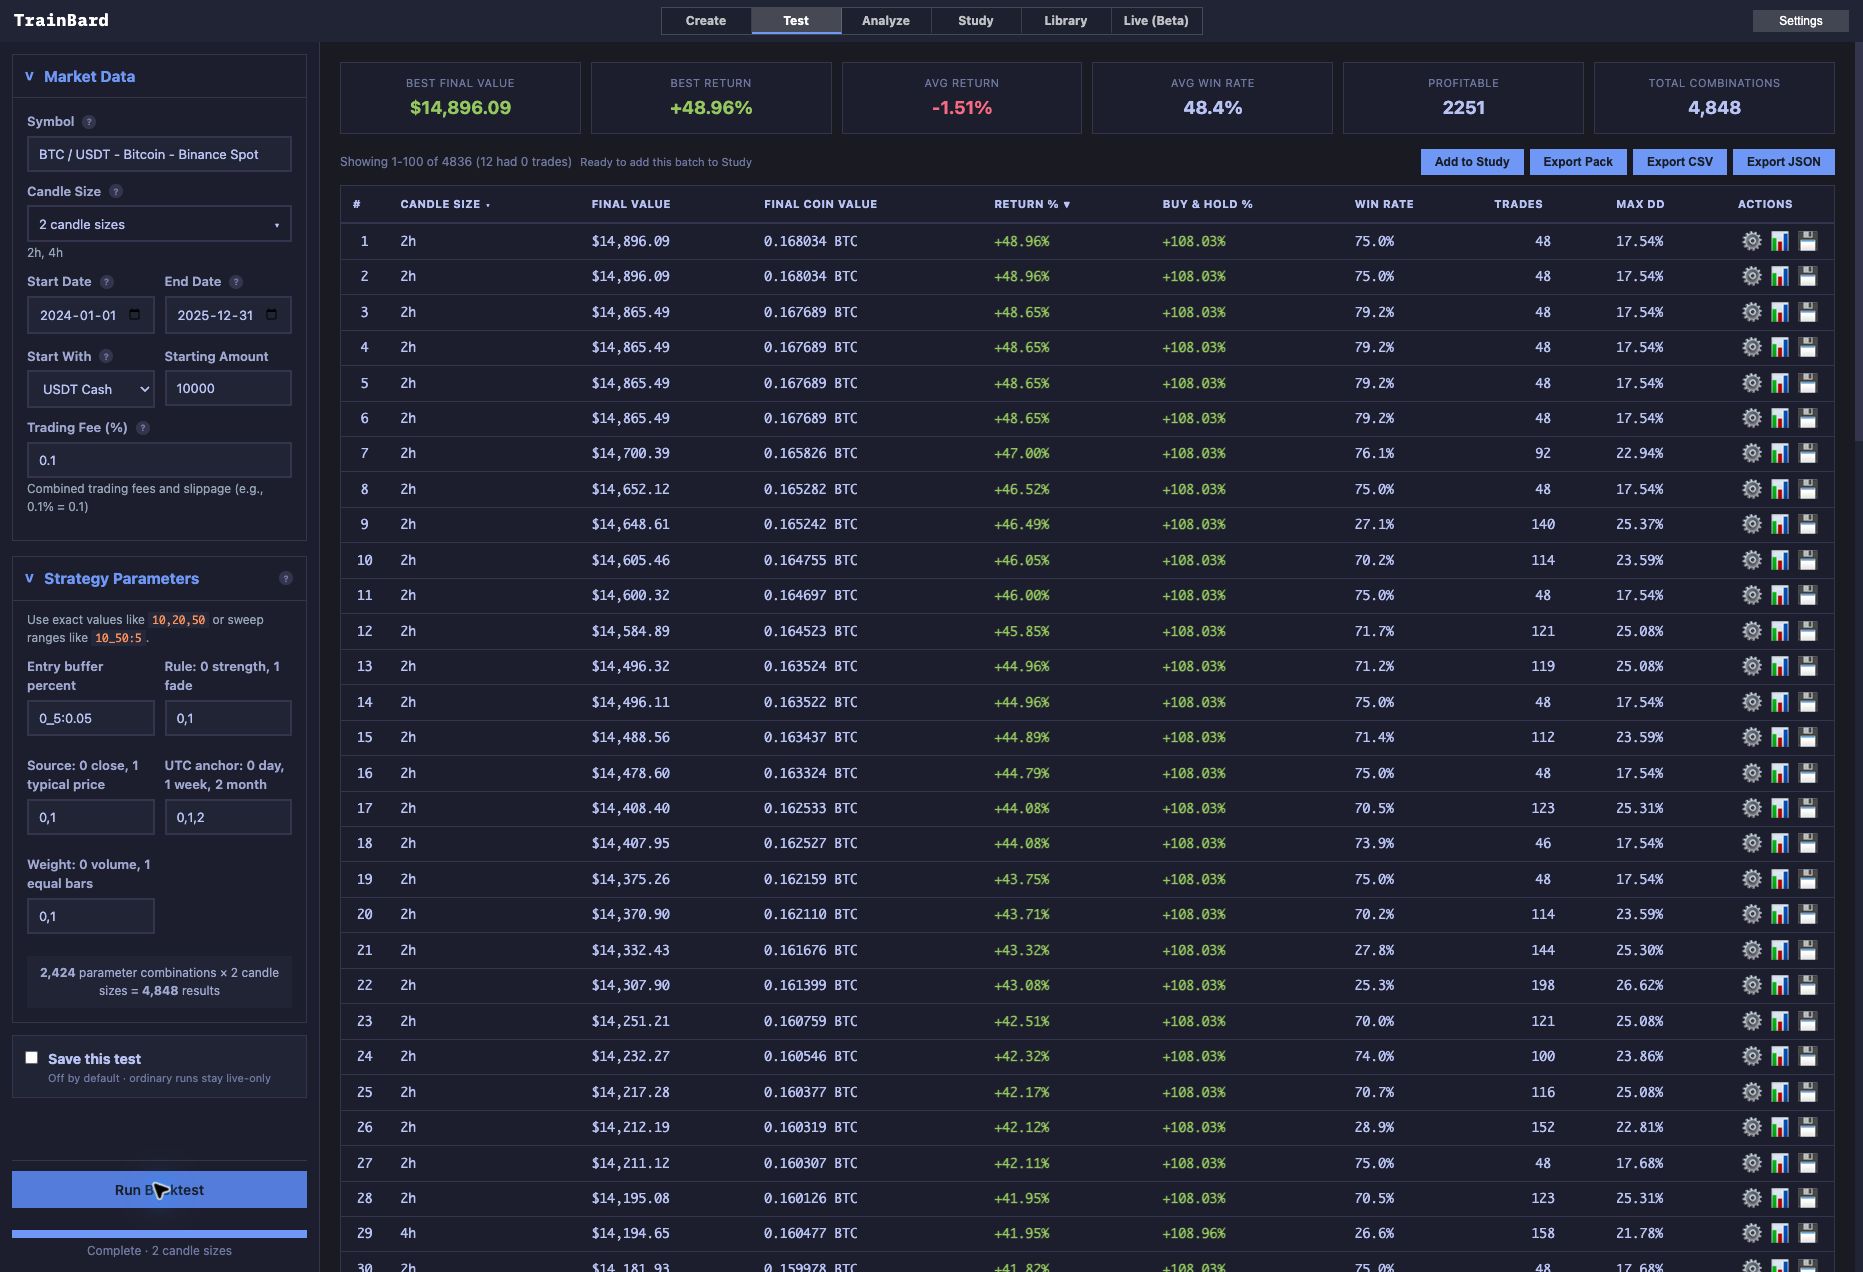
This completed later BTCUSDT two- and four-hour batch is one part of the study. Its best displayed row is completion evidence, not a recommended setting.
For another view of volume, see On-Balance Volume. For the effect of a rolling window, see the simple moving average guide.