Key takeaways
- Turtle trading combines channel breakouts with volatility sizing and portfolio rules; these tests isolate a long-only channel adaptation.
- Across 293,088 valid historical evaluations, close confirmation usually reduced executions, but its interaction with a volatility exit produced concentrated reversals.
- A close-checked N-based exit did not uniformly reduce account drawdown and does not guarantee an intrabar loss limit.
We completed 293,088 valid, related historical evaluations of a long-only Turtle channel adaptation across eight fixed samples. Waiting for a confirmed entry usually reduced executions, but its interaction with a volatility exit sometimes made the stricter rule busier. The rules below explain why entry, exit and position state must be read together.
What is the Turtle trading strategy?
The Turtle trading strategy is the systematic trend-following approach taught by Richard Dennis and William Eckhardt. Its best-known signal is a breakout: buy when price exceeds a previous high, then hold while a separate exit rule follows the move.
A channel strategy makes no forecast of where price should go. It asks whether price has done something it has not done within the chosen lookback. The difficult part is accepting repeated false starts while leaving enough room for a sustained move.
The familiar 20/10 and 55/20 pairs mean a longer entry lookback and a shorter exit lookback. They originally refer to daily bars. On a different chart, the same numbers describe a different amount of elapsed time; they do not preserve the original trading horizon.
Original Turtle trading rules
Curtis Faith, one of the original Turtles, published the complete rules. System 1 uses a 20-day breakout and a 10-day opposite-channel exit; System 2 uses 55 and 20. The first system also filters entries using what the previous breakout would have done, including a hypothetical trade not taken, and has a longer failsafe entry. The original system includes volatility-based sizing, a standard 2N protective stop, adding to positions and portfolio limits. Original Turtle Rules
That distinction matters when reading a backtest. A single channel entry is one component of Turtle trading. Our experiments below isolate its long-only channel behavior, using fixed allocation and candle-based signals. They do not reproduce the full original system.
| Component | Familiar rule | What our experiment varies |
|---|---|---|
| Entry | Break above a prior high | Lookback and wick versus closing-price confirmation |
| Exit | Break below a shorter prior low | Lookback and wick versus closing-price confirmation |
| Volatility | N measures true range | Optional fixed-N, close-checked protective exit |
| Position size | Volatility-based units | Fixed allocation for matched comparisons |
Donchian channels: the current candle must stay outside the calculation
The upper boundary is the highest high of the preceding entry candles. The lower exit boundary is the lowest low of the preceding exit candles. Both exclude the candle being tested.
For example, if the prior entry high is 100, a current high of 101 breaks it. If that candle closes at 99.5, a rule that requires a closing price above 100 has no entry signal. Including the current high in the channel would move the boundary to at least 101 and make a strict breakout comparison impossible.
This is also why breaching with a wick and closing beyond a channel should be treated as separate choices. Confirmation can remove a brief excursion, but it can also delay a real trend. The same decision exists on the way out.
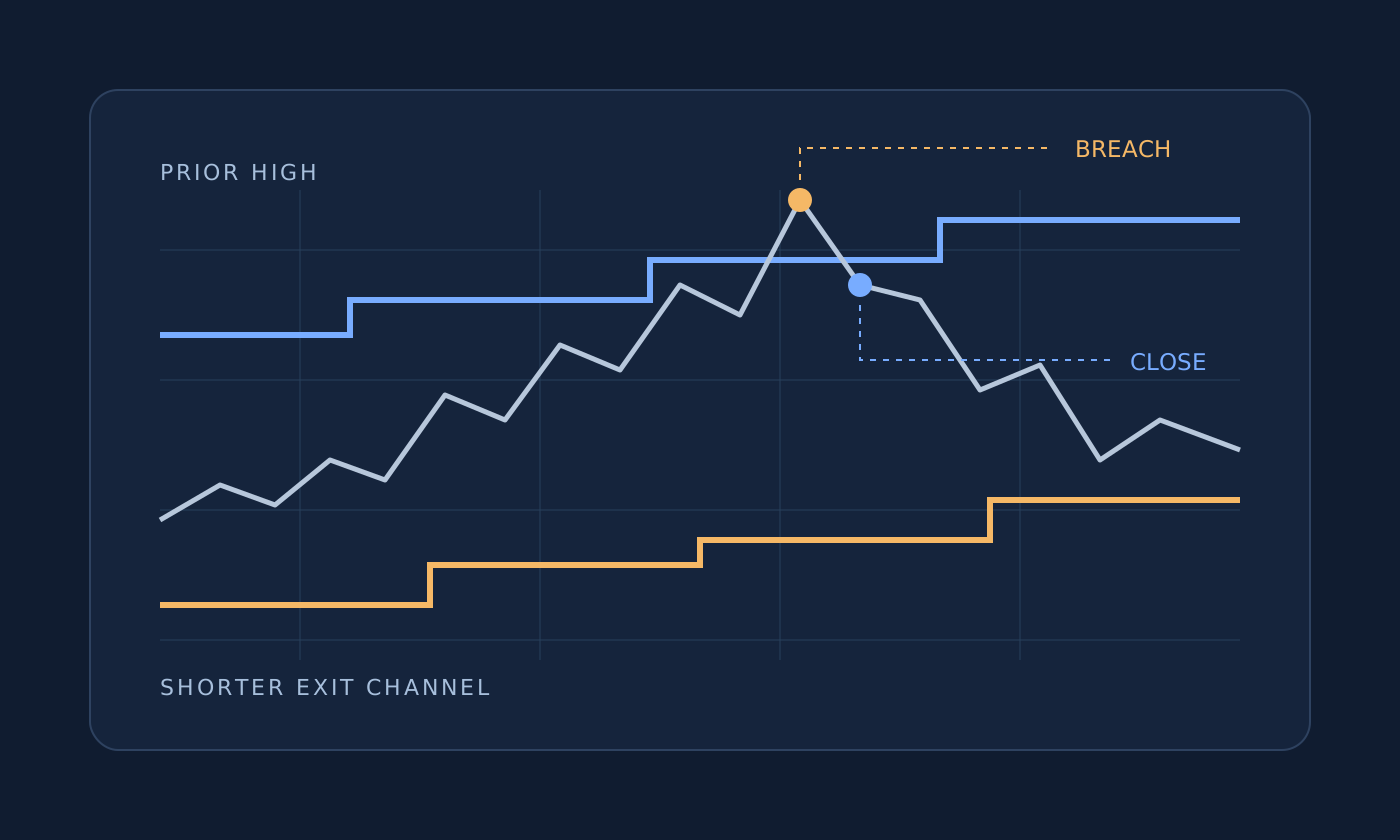
A breach and a confirmed close are different observations. Zero in each distance panel is the prior channel boundary.
The value table below is available without JavaScript.
Data and calculation details
Accessible value table (80 observations)
| Observation | Distance above prior entry high (basis points) · Close versus prior20-high | Distance above prior entry high (basis points) · High versus prior20-high | Distance above prior exit low (basis points) · Close versus prior10-low | Distance above prior exit low (basis points) · Low versus prior10-low |
|---|---|---|---|---|
| 2021-05-06T00:00:00Z | -212.496 | -86.072 | 540.220 | 491.039 |
| 2021-05-06T02:00:00Z | -219.172 | -155.713 | 533.030 | 502.535 |
| 2021-05-06T04:00:00Z | -155.466 | -86.344 | 455.000 | 369.587 |
| 2021-05-06T06:00:00Z | -216.124 | -155.466 | 329.962 | 242.120 |
| 2021-05-06T08:00:00Z | -139.186 | -128.263 | 405.018 | 316.194 |
| 2021-05-06T10:00:00Z | -14.090 | 49.971 | 418.312 | 267.754 |
| 2021-05-06T12:00:00Z | -186.547 | -44.722 | 166.807 | 127.868 |
| 2021-05-06T14:00:00Z | -217.874 | -164.498 | 134.353 | 76.572 |
| 2021-05-06T16:00:00Z | -271.247 | -151.645 | 79.057 | 43.054 |
| 2021-05-06T18:00:00Z | -382.382 | -238.177 | -36.079 | -200.892 |
| 2021-05-06T20:00:00Z | -353.578 | -326.796 | 198.645 | 85.893 |
| 2021-05-06T22:00:00Z | -336.929 | -268.266 | 216.246 | 178.652 |
| 2021-05-07T00:00:00Z | -370.619 | -212.102 | 180.629 | 126.812 |
| 2021-05-07T02:00:00Z | -454.820 | -336.357 | 91.607 | 50.134 |
| 2021-05-07T04:00:00Z | -439.452 | -386.165 | 107.855 | 7.542 |
| 2021-05-07T06:00:00Z | -444.424 | -356.258 | 102.598 | 79.777 |
| 2021-05-07T08:00:00Z | -364.726 | -310.144 | 186.859 | 67.092 |
| 2021-05-07T10:00:00Z | -324.753 | -270.048 | 229.120 | 184.279 |
| 2021-05-07T12:00:00Z | -233.470 | -116.518 | 325.629 | 186.275 |
| 2021-05-07T14:00:00Z | -144.064 | -130.226 | 420.152 | 271.014 |
| 2021-05-07T16:00:00Z | -41.126 | 49.692 | 521.049 | 342.318 |
| 2021-05-07T18:00:00Z | -181.754 | -75.250 | 424.024 | 396.145 |
| 2021-05-07T20:00:00Z | -220.215 | -98.157 | 383.191 | 344.916 |
| 2021-05-07T22:00:00Z | -227.664 | -183.923 | 375.282 | 273.004 |
| 2021-05-08T00:00:00Z | -186.038 | -146.839 | 419.477 | 300.203 |
| 2021-05-08T02:00:00Z | -93.780 | -42.626 | 455.212 | 347.306 |
| 2021-05-08T04:00:00Z | -131.633 | -8.527 | 415.261 | 399.611 |
| 2021-05-08T06:00:00Z | -31.874 | -18.754 | 399.493 | 228.183 |
| 2021-05-08T08:00:00Z | 25.574 | 124.341 | 457.377 | 396.607 |
| 2021-05-08T10:00:00Z | -138.629 | -82.733 | 328.081 | 283.794 |
| 2021-05-08T12:00:00Z | -92.795 | 10.000 | 366.257 | 257.976 |
| 2021-05-08T14:00:00Z | -309.356 | -63.703 | 149.802 | 127.437 |
| 2021-05-08T16:00:00Z | -90.793 | -65.309 | 378.721 | 142.887 |
| 2021-05-08T18:00:00Z | -68.656 | -23.325 | 401.907 | 372.412 |
| 2021-05-08T20:00:00Z | -110.391 | 10.323 | 330.842 | 302.849 |
| 2021-05-08T22:00:00Z | -107.218 | -63.874 | 241.696 | 172.786 |
| 2021-05-09T00:00:00Z | -62.834 | -43.768 | 287.647 | 148.268 |
| 2021-05-09T02:00:00Z | -145.751 | -33.613 | 201.805 | 172.779 |
| 2021-05-09T04:00:00Z | -177.057 | -88.250 | 169.394 | 17.756 |
| 2021-05-09T06:00:00Z | -257.884 | -147.872 | 85.717 | 41.543 |
| 2021-05-09T08:00:00Z | -260.081 | -184.874 | 83.443 | 20.356 |
| 2021-05-09T10:00:00Z | -267.649 | -218.487 | 75.608 | 10.903 |
| 2021-05-09T12:00:00Z | -383.190 | -252.101 | -54.851 | -225.938 |
| 2021-05-09T14:00:00Z | -356.373 | -338.655 | 203.415 | 135.917 |
| 2021-05-09T16:00:00Z | -343.071 | -271.746 | 217.490 | 182.598 |
| 2021-05-09T18:00:00Z | -375.299 | -312.908 | 183.391 | 144.624 |
| 2021-05-09T20:00:00Z | -247.750 | -221.849 | 318.344 | 167.780 |
| 2021-05-09T22:00:00Z | -211.624 | -178.202 | 356.567 | 287.067 |
| 2021-05-10T00:00:00Z | -134.418 | -86.555 | 438.254 | 315.512 |
| 2021-05-10T02:00:00Z | -24.074 | -9.261 | 555.004 | 429.395 |
| 2021-05-10T04:00:00Z | -72.597 | 0.000 | 503.664 | 434.706 |
| 2021-05-10T06:00:00Z | -189.887 | -53.782 | 379.565 | 377.008 |
| 2021-05-10T08:00:00Z | -268.966 | -152.304 | 295.896 | 266.877 |
| 2021-05-10T10:00:00Z | -240.230 | -201.681 | 187.830 | 52.949 |
| 2021-05-10T12:00:00Z | -306.582 | -213.200 | 109.885 | 71.174 |
| 2021-05-10T14:00:00Z | -202.292 | -198.319 | 218.654 | -61.169 |
| 2021-05-10T16:00:00Z | -422.639 | -152.319 | 50.317 | 26.411 |
| 2021-05-10T18:00:00Z | -632.982 | -387.341 | -170.413 | -208.668 |
| 2021-05-10T20:00:00Z | -648.553 | -614.607 | 22.382 | -381.299 |
| 2021-05-10T22:00:00Z | -619.136 | -542.876 | 452.461 | 368.380 |
| 2021-05-11T00:00:00Z | -661.289 | -515.045 | 405.493 | 311.635 |
| 2021-05-11T02:00:00Z | -732.360 | -597.939 | 326.303 | 181.648 |
| 2021-05-11T04:00:00Z | -790.252 | -664.590 | 261.798 | 222.659 |
| 2021-05-11T06:00:00Z | -631.918 | -613.966 | 438.219 | 247.545 |
| 2021-05-11T08:00:00Z | -604.849 | -583.592 | 468.380 | 328.303 |
| 2021-05-11T10:00:00Z | -720.929 | -556.303 | 339.039 | 323.167 |
| 2021-05-11T12:00:00Z | -630.252 | -628.570 | 440.075 | 255.888 |
| 2021-05-11T14:00:00Z | -579.358 | -558.655 | 496.783 | 390.476 |
| 2021-05-11T16:00:00Z | -521.832 | -495.224 | 560.880 | 440.075 |
| 2021-05-11T18:00:00Z | -485.892 | -445.378 | 411.797 | 345.665 |
| 2021-05-11T20:00:00Z | -502.477 | -443.289 | 393.647 | 352.847 |
| 2021-05-11T22:00:00Z | -424.126 | -407.577 | 423.031 | 330.877 |
| 2021-05-12T00:00:00Z | -266.315 | -210.555 | 447.773 | 360.168 |
| 2021-05-12T02:00:00Z | -142.807 | -123.140 | 554.632 | 404.032 |
| 2021-05-12T04:00:00Z | -233.083 | -101.323 | 449.461 | 437.051 |
| 2021-05-12T06:00:00Z | -254.742 | -209.371 | 426.288 | 386.288 |
| 2021-05-12T08:00:00Z | -296.665 | -238.626 | 381.436 | 331.144 |
| 2021-05-12T10:00:00Z | -272.164 | -196.379 | 168.751 | 83.862 |
| 2021-05-12T12:00:00Z | -213.776 | -198.278 | 181.186 | -8.969 |
| 2021-05-12T14:00:00Z | -434.634 | -189.657 | -39.654 | -83.921 |
Select the two annotated moments. The first recognizes an upper-channel breach without a confirmed close. The second recognizes a lower-channel breach that recovers before the close. These are historical indicator observations, with no reconstructed trades.
In our research rules, each candle is evaluated after it closes. A wick signal recognizes that its high or low breached the prior boundary; a close signal requires the closing price to finish beyond it. Both submit market orders for the next candle’s open. The wick rule therefore does not claim an intraday fill at the boundary.
Can a stricter breakout rule trade more often?
We ran 293,088 valid, related historical evaluations of the channel rule across eight fixed samples. Entry and exit lookbacks, confirmation choices and an optional N-based exit formed the grid. Every paired comparison holds the other choices fixed and changes one rule.
Usually, requiring the close to finish beyond the entry channel reduced recorded executions: it did so in 146,059/146,544 matched entry comparisons. But 326 comparisons reversed that relationship, and 159 tied. A stricter signal produced more account activity in those reversals.
The interactive comparison shows one such neighborhood. Every line uses the same 32-bar closing-price channel exit and the same historical prices. Dashed lines omit the extra N exit; solid lines add the close-checked 2N rule, which sets a closing-price threshold two frozen volatility units below the actual entry fill. Only entry memory changes along the horizontal axis.
Only entry memory changes along the horizontal axis. Dashed lines turn the extra N exit off; solid lines add the 2N rule checked at the close. A stricter entry can then become the busier rule.
The value table below is available without JavaScript.
Data and calculation details
Accessible value table (31 observations)
| Observation | Recorded executions (buys and sells) · Close entry, stop off | Recorded executions (buys and sells) · Wick entry, stop off | Recorded executions (buys and sells) · Close entry, 2N exit | Recorded executions (buys and sells) · Wick entry, 2N exit |
|---|---|---|---|---|
| 70 | 49.000 | 57.000 | 54.000 | 61.000 |
| 71 | 49.000 | 55.000 | 54.000 | 59.000 |
| 72 | 49.000 | 53.000 | 56.000 | 57.000 |
| 73 | 49.000 | 53.000 | 56.000 | 57.000 |
| 74 | 49.000 | 53.000 | 56.000 | 55.000 |
| 75 | 47.000 | 53.000 | 54.000 | 55.000 |
| 76 | 47.000 | 49.000 | 54.000 | 51.000 |
| 77 | 47.000 | 49.000 | 54.000 | 51.000 |
| 78 | 47.000 | 49.000 | 54.000 | 51.000 |
| 79 | 47.000 | 49.000 | 54.000 | 51.000 |
| 80 | 47.000 | 49.000 | 54.000 | 51.000 |
| 81 | 47.000 | 49.000 | 54.000 | 51.000 |
| 82 | 47.000 | 49.000 | 54.000 | 51.000 |
| 83 | 47.000 | 49.000 | 54.000 | 51.000 |
| 84 | 47.000 | 49.000 | 54.000 | 51.000 |
| 85 | 47.000 | 49.000 | 54.000 | 49.000 |
| 86 | 47.000 | 49.000 | 54.000 | 49.000 |
| 87 | 47.000 | 49.000 | 54.000 | 49.000 |
| 88 | 47.000 | 49.000 | 54.000 | 49.000 |
| 89 | 47.000 | 49.000 | 54.000 | 49.000 |
| 90 | 47.000 | 49.000 | 54.000 | 51.000 |
| 91 | 45.000 | 49.000 | 52.000 | 51.000 |
| 92 | 45.000 | 49.000 | 52.000 | 51.000 |
| 93 | 43.000 | 49.000 | 52.000 | 51.000 |
| 94 | 43.000 | 49.000 | 50.000 | 49.000 |
| 95 | 43.000 | 49.000 | 50.000 | 51.000 |
| 96 | 41.000 | 49.000 | 48.000 | 51.000 |
| 97 | 41.000 | 49.000 | 48.000 | 51.000 |
| 98 | 39.000 | 49.000 | 46.000 | 51.000 |
| 99 | 39.000 | 49.000 | 46.000 | 53.000 |
| 100 | 39.000 | 47.000 | 46.000 | 49.000 |
At 85 entry bars, requiring a close produces 47 executions versus 49 for the wick rule when the extra stop is off. With the 2N rule, the same comparison becomes 54 versus 49. Executions count buys and sells, not completed round trips.
The entry filter changes when the position begins, its actual fill and the volatility value frozen for its stop. Those references change when the account becomes flat and which later breakouts it can take. We repeated both 85/32 settings separately and checked all 54 and 49 recorded executions against official candles. In one observed retreat, put the closing price at 100: the close-entry holding’s frozen stop is 101.30, the wick-entry holding’s is 94.06, and their shared channel exit is 88.88. One stop triggers while the other holding stays open; neither channel exit triggers. This supports the mechanism in these two traces; it does not attribute every reversal in the grid to the same event.
All 326 reversals occurred with the 2N rule in one of the eight historical samples; none occurred with the extra stop off or at 4N. They are a small, concentrated exception, not the typical outcome. The figure was selected after observing that region of the frozen grid. Its useful lesson is that eligible entry candles and completed account paths are different things. A stricter signal cannot create more qualifying candles under otherwise identical channel inputs, but it can create more executions after position state and exits interact.
Does waiting for the close reduce drawdown?
Confirmation also does different work at entry and exit. Close-confirmed entry had lower reported maximum drawdown in 108,756/146,544 pairs. Close-confirmed exit had higher reported maximum drawdown in 96,677/146,544 pairs. Before entry, waiting filters exposure. After entry, waiting tolerates a retreat. Both usually reduced executions, but calling both choices “confirmation” hides their different roles.
These are descriptive associations within related historical settings, with exceptions. Return need not move with drawdown: close confirmation gave higher return in 100,875 entry pairs and 87,225 exit pairs, out of 146,544 each.
Turtle stops, false breakouts and the cost of waiting
N averages true range, including gaps from the preceding close. True range is the largest of the high–low range, the distance from high to prior close, and the distance from low to prior close. After its initial average, the familiar 20-bar calculation is N = (19 × prior N + current true range) / 20. A stop expressed in N adjusts its price distance to recent volatility. A wider distance gives the position more room, while a tighter one can remove a trade before the channel exit arrives.
Our optional protective rule freezes ATR over 20 bars at the entry signal, measures the distance below the actual fill, and checks it against subsequent closes. It then requests a next-open exit. This close-checked rule can lose more than its stated N distance; it is not a resting stop order or a guaranteed maximum loss.
A protective exit did not make the account’s drawdown uniformly smaller. Adding the close-checked 2N rule lowered reported maximum drawdown in 63,662 matched comparisons, raised it in 26,123, and left it unchanged in 7,911, out of 97,696. In a separate 20/10, close/close example, it raised reported drawdown from 34.06% to 38.65% while return fell from +7.16% to +4.56%. An exit can cut one trade short and still change later entries, missed recoveries and the path of account losses.
A false breakout can cause a loss even when the calculation is correct. Price may exceed the previous range and reverse, the next open may differ from the signal close, or costs may consume a small move. Adding confirmation changes the path through these events. Whether that tradeoff helped is an empirical question.
Which Turtle settings are best?
Treat 20/10 and 55/20 as familiar reference pairs. An entry lookback controls which highs qualify as new; an exit lookback controls how much retreat a holding tolerates. Shorter exits and stricter entries perform different jobs. A useful comparison changes one choice at a time and checks neighboring settings, activity, return and drawdown together.
The same grid was repeated unchanged. Around the familiar 55/20 pair, the table counts how many of the eight historical checks returned more than zero with close-confirmed entries and exits and no extra N stop. This neighborhood was chosen around the named rule, rather than around the best result. It measures repeatability of positive return; the download also retains worst reported drawdown and minimum activity for each cell.
Each cell counts profitable historical checks out of eight. Rows change entry memory; columns change exit memory. Positive return does not imply beating a passive holding.
| Entry bars / exit bars | 10 | 15 | 20 | 25 | 30 |
|---|---|---|---|---|---|
| 45 | 6/8 | 7/8 | 6/8 | 5/8 | 7/8 |
| 50 | 6/8 | 7/8 | 6/8 | 5/8 | 7/8 |
| 55 | 6/8 | 6/8 | 6/8 | 5/8 | 7/8 |
| 60 | 6/8 | 7/8 | 6/8 | 6/8 | 7/8 |
| 65 | 7/8 | 8/8 | 7/8 | 7/8 | 6/8 |
Of the 36,636 fixed parameter tuples observed in every sample, 5,746 were profitable in all eight. 0 beat a passive control with the same startup in all eight. These counts carry the same settings through each check; they do not pick a new winner for every sample.
A profitable configuration alone does not establish an advantage over holding the same prices, and a larger sweep does not turn related historical evaluations into independent trials.
Compare entry and reentry timing in the Alligator strategy, or see how a trailing level changes execution timing in Parabolic SAR.
Copy the strategy script
Copy this tested long-only channel adaptation into your editor. The defaults use a 20-bar entry, a 10-bar exit, closing-price confirmation, and no extra N stop. Set the study’s combined trading cost to 0.1% per execution in your backtest settings.
//@version=6
strategy("Turtle Channel Mechanism Lab", overlay=true, initial_capital=10000, process_orders_on_close=false, default_qty_type=strategy.percent_of_equity, default_qty_value=99)

entry_length = input.int(20, "Entry channel bars", minval=2, maxval=200)
exit_length = input.int(10, "Exit channel bars", minval=1, maxval=100)
entry_mode = input.int(0, "Entry: 0 close, 1 wick", minval=0, maxval=1)
exit_mode = input.int(0, "Exit: 0 close, 1 wick", minval=0, maxval=1)
stop_n = input.float(0.0, "Close stop N: 0 off", minval=0.0, maxval=10.0)

entry_high = ta.highest(high, entry_length)[1]
exit_low = ta.lowest(low, exit_length)[1]
n = ta.atr(20)
valid = exit_length < entry_length
ready = bar_index >= 500
entry_signal = entry_mode == 0 ? close > entry_high : high > entry_high
exit_signal = exit_mode == 0 ? close < exit_low : low < exit_low
var entry_n = 0.0
stop_level = strategy.position_avg_price - stop_n * entry_n
stop_signal = stop_n > 0 and close < stop_level

plot(entry_high, "Prior entry channel", color=color.blue)
plot(exit_low, "Prior exit channel", color=color.orange)

if ready and valid and strategy.position_size > 0 and (exit_signal or stop_signal)
    strategy.close("Long")

if ready and valid and strategy.position_size == 0 and entry_signal
    entry_n := n
    strategy.entry("Long", strategy.long)
What we tested, and how to reproduce it
The study uses Binance Spot BTCUSDT and ETHUSDT on two-hour and four-hour candles. Exploration uses 2021-01-01–2023-12-31; historical replication uses 2024-01-01–2025-12-31. These are related historical checks, not untouched prospective holdouts or live-trading proof. All grids and the script were frozen after a 12-setting syntax/order smoke and before the first broad output. The same grid ran unchanged across all eight frames.
Each run starts with 10,000 USDT cash, uses long-only positions or cash with no leverage or cash interest, and targets 99% of equity to leave a reserve. Combined fees/slippage are 0.1% per execution. Orders normally execute at the next eligible candle’s open. The script waits 500 bars before acting, with no assumed pre-window history; that covers different elapsed time on the two candle sizes.
The entry grid is every integer from 10 through 100; the exit grid is every integer from 2 through 40. Entry and exit each recognize either the wick or the close beyond their own prior channel. Protective exit choices are off, 2N and 4N. Only exit length strictly below entry length is valid. Equality at any price boundary triggers neither comparison. The rule can act whenever its state condition is true; it does not require a fresh crossing after becoming flat. Channels exclude the current candle. N is the platform’s 20-bar Wilder-smoothed ATR, frozen on the entry-signal candle. The close stop is actual entry fill minus the chosen multiple of that frozen N. It is checked on closes and requests a next-open market exit, rather than supplying a resting intrabar stop order.
This adaptation excludes short positions, volatility-based sizing, pyramiding, portfolio/correlation limits, the System 1 hypothetical previous-breakout filter and its 55-day failsafe. In the original rules that filter considers hypothetical breakouts, including ones not taken, rather than simply skipping after a recorded winning long trade. Our 20/10 and 55/20 intraday examples are named-lookback comparisons, not reproductions of the original daily portfolio system.
Four joint batches requested 340,704 evaluations. Their 47,616 guarded-invalid combinations had no trades and are excluded from the 293,088 valid evaluations. All valid combinations exported traded rows; there are no omitted valid zero-trade rows, row errors or duplicate tuples. The separate 12-setting smoke is excluded because its settings recur in the broad grid; all its complete metrics reproduce exactly in the corresponding main output. Counts of settings sharing price history and deliberate repeats are not independent trials.
| Historical frame | Valid evaluations | Profitable settings | Median return | Startup-matched passive return |
|---|---|---|---|---|
| BTCUSDT, 2h, 2021–2023 | 36,636 | 27,428 | +31.38% | -10.95% |
| BTCUSDT, 4h, 2021–2023 | 36,636 | 27,124 | +19.18% | -19.03% |
| BTCUSDT, 2h, 2024–2025 | 36,636 | 23,449 | +9.75% | +82.55% |
| BTCUSDT, 4h, 2024–2025 | 36,636 | 24,136 | +4.92% | +34.90% |
| ETHUSDT, 2h, 2021–2023 | 36,636 | 22,039 | +10.14% | +28.11% |
| ETHUSDT, 4h, 2021–2023 | 36,636 | 33,184 | +53.93% | +42.85% |
| ETHUSDT, 2h, 2024–2025 | 36,636 | 31,173 | +31.21% | +18.37% |
| ETHUSDT, 4h, 2024–2025 | 36,636 | 26,324 | +16.29% | -12.26% |
The main stop-interaction chart foregrounds ETHUSDT four-hour 2021–2023 results, with exit length 32 and closing-price exits. The entry range 70–100 and the 85-bar example were selected after observing reversals in the frozen grid; they are illustrations, not independently validated parameter recommendations. All 124 plotted values map to exact original T003 rows. The 20/10 stop example uses BTCUSDT two-hour 2021–2023. The 55/20 neighborhood uses close/close with no extra stop across all eight frames. Full per-frame paired counts, fixed-setting representatives, completion totals and source hashes are retained in the evidence download. Paired counts hold every other parameter and historical frame fixed; their large denominators do not create independent evidence from related settings.
For a broader view without an extra N exit, this separate representative chart uses BTCUSDT two-hour 2021–2023 with exit length 10. Its four lines vary the entry and exit confirmation choices; all 1,080 plotted values map to original T001 rows. Returns and reported drawdown remain visible alongside activity.
Each point changes only the entry lookback. Four lines separate entry confirmation from exit confirmation. These are related historical configurations, not independent trials.
The value table below is available without JavaScript.
Data and calculation details
Accessible value table (90 observations)
| Observation | Recorded executions · Close entry / close exit | Recorded executions · Wick entry / close exit | Recorded executions · Close entry / wick exit | Recorded executions · Wick entry / wick exit | Recorded return (%) · Close entry / close exit | Recorded return (%) · Wick entry / close exit | Recorded return (%) · Close entry / wick exit | Recorded return (%) · Wick entry / wick exit | Reported maximum drawdown (%) · Close entry / close exit | Reported maximum drawdown (%) · Wick entry / close exit | Reported maximum drawdown (%) · Close entry / wick exit | Reported maximum drawdown (%) · Wick entry / wick exit |
|---|---|---|---|---|---|---|---|---|---|---|---|---|
| 11 | 379.000 | 537.000 | 461.000 | 707.000 | -0.090 | -42.299 | -21.858 | -59.852 | 48.646 | 71.855 | 56.961 | 73.219 |
| 12 | 367.000 | 519.000 | 449.000 | 679.000 | -2.899 | -41.199 | -29.091 | -58.613 | 50.091 | 69.846 | 60.039 | 71.725 |
| 13 | 358.000 | 494.000 | 438.000 | 648.000 | -4.235 | -41.046 | -30.374 | -56.474 | 51.697 | 69.337 | 60.702 | 69.823 |
| 14 | 342.000 | 482.000 | 412.000 | 622.000 | -0.139 | -46.372 | -26.437 | -60.583 | 39.668 | 70.896 | 49.551 | 72.032 |
| 15 | 332.000 | 466.000 | 400.000 | 600.000 | 7.684 | -36.785 | -19.931 | -54.856 | 38.752 | 65.825 | 44.366 | 68.496 |
| 16 | 324.000 | 454.000 | 392.000 | 580.000 | 14.814 | -38.025 | -18.377 | -52.041 | 40.051 | 66.163 | 46.556 | 65.856 |
| 17 | 316.000 | 444.000 | 380.000 | 568.000 | 26.888 | -42.859 | -5.667 | -57.431 | 33.495 | 68.327 | 36.440 | 68.853 |
| 18 | 310.000 | 428.000 | 370.000 | 544.000 | 10.475 | -36.731 | -12.876 | -53.460 | 33.495 | 64.872 | 40.353 | 65.459 |
| 19 | 304.000 | 422.000 | 364.000 | 536.000 | 5.508 | -34.298 | -14.021 | -52.905 | 33.495 | 62.642 | 37.240 | 63.889 |
| 20 | 294.000 | 414.000 | 352.000 | 524.000 | 7.162 | -27.783 | -16.286 | -47.389 | 34.062 | 58.168 | 38.335 | 59.381 |
| 21 | 282.000 | 404.000 | 340.000 | 510.000 | 16.011 | -21.609 | -13.897 | -43.063 | 34.080 | 53.929 | 33.338 | 56.628 |
| 22 | 276.000 | 394.000 | 334.000 | 500.000 | 11.876 | -23.155 | -18.630 | -45.125 | 34.461 | 53.729 | 33.458 | 57.478 |
| 23 | 268.000 | 384.000 | 326.000 | 484.000 | 16.333 | -24.674 | -19.784 | -42.607 | 32.317 | 55.005 | 33.833 | 56.018 |
| 24 | 258.000 | 372.000 | 316.000 | 472.000 | 27.191 | -19.707 | -16.794 | -44.357 | 32.927 | 55.221 | 33.783 | 58.578 |
| 25 | 254.000 | 366.000 | 310.000 | 462.000 | 16.460 | -19.840 | -25.349 | -43.719 | 34.810 | 58.539 | 40.925 | 60.498 |
| 26 | 244.000 | 360.000 | 300.000 | 454.000 | 25.644 | -20.290 | -25.475 | -46.909 | 33.106 | 55.578 | 40.613 | 60.017 |
| 27 | 240.000 | 352.000 | 296.000 | 442.000 | 28.776 | -17.924 | -25.260 | -46.547 | 33.758 | 54.318 | 41.954 | 60.166 |
| 28 | 240.000 | 344.000 | 296.000 | 430.000 | 18.619 | -13.290 | -31.469 | -40.297 | 33.758 | 51.715 | 46.088 | 56.637 |
| 29 | 240.000 | 332.000 | 296.000 | 416.000 | 12.811 | -17.902 | -35.966 | -40.588 | 34.359 | 53.921 | 47.656 | 55.741 |
| 30 | 236.000 | 324.000 | 292.000 | 408.000 | 16.060 | -13.608 | -34.996 | -38.825 | 32.468 | 56.287 | 46.862 | 58.015 |
| 31 | 236.000 | 322.000 | 290.000 | 406.000 | 10.056 | -21.281 | -37.946 | -44.259 | 34.931 | 59.299 | 49.274 | 60.907 |
| 32 | 230.000 | 316.000 | 284.000 | 400.000 | 15.390 | -15.420 | -36.074 | -41.381 | 34.610 | 56.008 | 47.433 | 58.591 |
| 33 | 224.000 | 314.000 | 278.000 | 398.000 | 19.384 | -14.577 | -33.688 | -44.145 | 34.143 | 55.936 | 46.963 | 59.411 |
| 34 | 222.000 | 310.000 | 276.000 | 394.000 | 18.260 | -16.869 | -36.383 | -47.357 | 34.763 | 57.027 | 48.299 | 60.655 |
| 35 | 222.000 | 298.000 | 276.000 | 380.000 | 13.031 | -16.706 | -39.196 | -46.623 | 37.648 | 56.421 | 50.585 | 60.696 |
| 36 | 216.000 | 298.000 | 270.000 | 380.000 | 26.622 | -29.151 | -33.805 | -54.598 | 31.480 | 57.780 | 47.213 | 65.612 |
| 37 | 210.000 | 290.000 | 264.000 | 372.000 | 29.198 | -16.407 | -32.459 | -48.376 | 33.088 | 50.369 | 45.815 | 60.899 |
| 38 | 210.000 | 290.000 | 264.000 | 372.000 | 23.139 | -20.012 | -35.626 | -50.603 | 33.262 | 52.237 | 47.684 | 62.509 |
| 39 | 202.000 | 280.000 | 256.000 | 362.000 | 30.824 | -10.714 | -30.619 | -46.693 | 33.815 | 48.317 | 43.463 | 58.959 |
| 40 | 198.000 | 272.000 | 252.000 | 354.000 | 33.834 | -6.177 | -28.818 | -46.009 | 34.618 | 45.606 | 42.462 | 57.755 |
| 41 | 194.000 | 266.000 | 246.000 | 344.000 | 37.899 | -2.277 | -21.696 | -41.977 | 34.618 | 44.112 | 36.705 | 54.600 |
| 42 | 194.000 | 264.000 | 244.000 | 340.000 | 28.269 | -0.546 | -22.248 | -40.023 | 34.540 | 42.281 | 36.787 | 53.396 |
| 43 | 192.000 | 264.000 | 242.000 | 340.000 | 29.469 | -5.196 | -23.509 | -43.916 | 35.068 | 44.221 | 37.297 | 55.582 |
| 44 | 190.000 | 260.000 | 240.000 | 336.000 | 32.132 | 0.189 | -23.174 | -40.731 | 35.068 | 40.898 | 37.297 | 53.059 |
| 45 | 186.000 | 254.000 | 236.000 | 330.000 | 35.702 | 5.672 | -22.149 | -37.482 | 35.598 | 38.657 | 37.811 | 50.486 |
| 46 | 182.000 | 246.000 | 230.000 | 322.000 | 40.439 | 15.578 | -19.804 | -31.727 | 34.259 | 35.747 | 36.026 | 45.852 |
| 47 | 180.000 | 244.000 | 228.000 | 320.000 | 45.262 | 11.313 | -18.288 | -34.641 | 31.355 | 36.356 | 34.197 | 48.163 |
| 48 | 178.000 | 242.000 | 224.000 | 318.000 | 44.402 | 13.710 | -15.190 | -34.120 | 31.355 | 36.356 | 34.197 | 47.882 |
| 49 | 176.000 | 240.000 | 222.000 | 316.000 | 39.095 | 15.629 | -18.307 | -33.008 | 33.185 | 38.053 | 35.952 | 47.002 |
| 50 | 174.000 | 238.000 | 220.000 | 314.000 | 40.413 | 10.464 | -14.775 | -35.999 | 30.630 | 41.916 | 33.183 | 49.147 |
| 51 | 172.000 | 236.000 | 218.000 | 312.000 | 42.493 | 11.846 | -13.512 | -35.199 | 30.630 | 42.483 | 33.183 | 49.191 |
| 52 | 170.000 | 232.000 | 214.000 | 306.000 | 47.670 | 22.113 | -7.931 | -29.662 | 30.630 | 37.636 | 30.510 | 45.714 |
| 53 | 168.000 | 230.000 | 212.000 | 304.000 | 44.999 | 17.804 | -9.597 | -32.145 | 31.150 | 36.410 | 31.836 | 47.401 |
| 54 | 166.000 | 226.000 | 208.000 | 300.000 | 40.493 | 23.282 | -9.350 | -31.660 | 31.909 | 33.792 | 33.059 | 45.917 |
| 55 | 162.000 | 220.000 | 204.000 | 294.000 | 49.726 | 31.967 | -3.963 | -27.277 | 29.588 | 30.675 | 30.701 | 42.449 |
| 56 | 158.000 | 212.000 | 200.000 | 286.000 | 60.501 | 37.845 | 3.326 | -26.080 | 24.859 | 31.989 | 25.784 | 42.553 |
| 57 | 156.000 | 208.000 | 198.000 | 282.000 | 71.193 | 45.819 | 10.209 | -22.392 | 24.593 | 32.132 | 23.113 | 39.687 |
| 58 | 154.000 | 204.000 | 196.000 | 276.000 | 75.328 | 56.945 | 11.690 | -19.800 | 24.593 | 33.806 | 23.113 | 38.431 |
| 59 | 152.000 | 202.000 | 194.000 | 274.000 | 80.548 | 64.172 | 15.015 | -16.107 | 24.593 | 31.779 | 23.113 | 35.596 |
| 60 | 152.000 | 200.000 | 194.000 | 272.000 | 80.548 | 72.074 | 15.015 | -12.069 | 24.593 | 28.215 | 23.113 | 32.496 |
| 61 | 148.000 | 198.000 | 188.000 | 270.000 | 84.448 | 76.544 | 20.458 | -9.785 | 24.593 | 28.448 | 22.126 | 30.742 |
| 62 | 146.000 | 196.000 | 186.000 | 268.000 | 95.756 | 82.491 | 27.843 | -6.746 | 24.593 | 27.688 | 22.126 | 28.409 |
| 63 | 146.000 | 194.000 | 186.000 | 266.000 | 84.800 | 89.081 | 20.688 | -3.379 | 24.593 | 24.616 | 22.126 | 27.752 |
| 64 | 144.000 | 188.000 | 184.000 | 260.000 | 81.349 | 98.160 | 18.430 | 2.286 | 25.348 | 23.422 | 22.126 | 27.752 |
| 65 | 142.000 | 188.000 | 180.000 | 258.000 | 70.106 | 83.274 | 15.161 | 0.318 | 27.878 | 30.415 | 28.868 | 29.158 |
| 66 | 142.000 | 188.000 | 180.000 | 258.000 | 70.106 | 73.775 | 15.161 | -4.881 | 27.878 | 26.186 | 28.868 | 30.314 |
| 67 | 142.000 | 188.000 | 180.000 | 258.000 | 70.106 | 67.171 | 15.161 | -8.496 | 27.878 | 30.415 | 28.868 | 30.314 |
| 68 | 142.000 | 186.000 | 180.000 | 254.000 | 68.199 | 70.512 | 13.870 | -4.317 | 27.878 | 30.415 | 28.868 | 30.314 |
| 69 | 142.000 | 184.000 | 180.000 | 252.000 | 66.997 | 72.381 | 13.054 | -3.171 | 28.183 | 30.781 | 29.171 | 30.612 |
| 70 | 142.000 | 184.000 | 180.000 | 252.000 | 66.997 | 71.876 | 13.054 | -3.455 | 28.183 | 30.781 | 29.171 | 30.612 |
| 71 | 138.000 | 184.000 | 174.000 | 252.000 | 70.245 | 70.090 | 16.070 | -4.457 | 23.392 | 30.639 | 26.175 | 30.469 |
| 72 | 138.000 | 184.000 | 174.000 | 252.000 | 70.245 | 70.090 | 16.070 | -4.457 | 23.392 | 30.639 | 26.175 | 30.469 |
| 73 | 138.000 | 184.000 | 174.000 | 250.000 | 70.245 | 59.291 | 16.070 | -7.024 | 23.392 | 30.639 | 26.175 | 30.469 |
| 74 | 134.000 | 182.000 | 170.000 | 244.000 | 84.480 | 59.312 | 21.144 | -2.929 | 14.144 | 28.944 | 19.890 | 28.769 |
| 75 | 134.000 | 182.000 | 170.000 | 244.000 | 84.480 | 58.372 | 21.144 | -3.502 | 14.144 | 28.918 | 19.890 | 28.743 |
| 76 | 132.000 | 182.000 | 168.000 | 244.000 | 92.223 | 58.372 | 26.228 | -3.502 | 14.144 | 28.918 | 19.890 | 28.743 |
| 77 | 132.000 | 180.000 | 168.000 | 242.000 | 91.535 | 59.130 | 25.777 | -3.842 | 14.144 | 28.918 | 19.890 | 28.743 |
| 78 | 130.000 | 176.000 | 166.000 | 238.000 | 97.723 | 70.904 | 28.534 | 2.235 | 14.144 | 28.918 | 19.890 | 28.743 |
| 79 | 130.000 | 176.000 | 166.000 | 238.000 | 88.867 | 60.814 | 22.778 | -3.801 | 14.361 | 28.918 | 24.279 | 28.743 |
| 80 | 128.000 | 174.000 | 164.000 | 236.000 | 92.404 | 62.139 | 25.077 | -3.009 | 14.361 | 28.918 | 20.093 | 28.743 |
| 81 | 126.000 | 172.000 | 162.000 | 234.000 | 95.199 | 69.566 | 26.894 | -1.729 | 13.117 | 22.843 | 24.279 | 26.939 |
| 82 | 126.000 | 172.000 | 162.000 | 234.000 | 95.199 | 69.566 | 26.894 | -1.729 | 13.117 | 22.843 | 24.279 | 26.939 |
| 83 | 126.000 | 172.000 | 162.000 | 234.000 | 91.553 | 69.321 | 24.516 | -1.871 | 13.117 | 22.843 | 25.503 | 26.853 |
| 84 | 122.000 | 172.000 | 158.000 | 234.000 | 83.959 | 57.341 | 18.875 | -8.813 | 20.201 | 25.989 | 27.770 | 29.474 |
| 85 | 122.000 | 172.000 | 158.000 | 234.000 | 83.959 | 56.871 | 18.875 | -9.086 | 20.201 | 25.989 | 27.770 | 29.474 |
| 86 | 122.000 | 172.000 | 158.000 | 234.000 | 83.959 | 55.597 | 18.875 | -9.824 | 20.201 | 25.989 | 27.770 | 29.474 |
| 87 | 122.000 | 170.000 | 158.000 | 232.000 | 83.959 | 58.078 | 18.875 | -9.839 | 20.201 | 25.989 | 27.770 | 29.474 |
| 88 | 122.000 | 166.000 | 156.000 | 226.000 | 76.721 | 59.005 | 19.695 | -6.056 | 20.201 | 25.989 | 27.770 | 30.230 |
| 89 | 120.000 | 166.000 | 154.000 | 226.000 | 79.602 | 56.683 | 21.646 | -7.428 | 20.201 | 25.989 | 27.770 | 30.230 |
| 90 | 120.000 | 166.000 | 154.000 | 226.000 | 79.602 | 56.683 | 21.646 | -7.428 | 20.201 | 25.989 | 27.770 | 30.230 |
| 91 | 118.000 | 166.000 | 152.000 | 226.000 | 82.356 | 56.683 | 23.159 | -7.428 | 20.201 | 25.989 | 27.770 | 30.230 |
| 92 | 118.000 | 166.000 | 152.000 | 226.000 | 82.356 | 56.683 | 23.159 | -7.428 | 20.201 | 25.989 | 27.770 | 30.230 |
| 93 | 118.000 | 162.000 | 152.000 | 222.000 | 82.356 | 62.777 | 23.159 | -3.827 | 20.201 | 24.597 | 27.770 | 28.918 |
| 94 | 118.000 | 162.000 | 152.000 | 222.000 | 81.707 | 62.197 | 22.720 | -4.170 | 20.201 | 24.597 | 28.028 | 29.171 |
| 95 | 118.000 | 162.000 | 152.000 | 222.000 | 79.609 | 60.325 | 21.304 | -5.276 | 21.074 | 24.597 | 28.858 | 29.988 |
| 96 | 114.000 | 162.000 | 148.000 | 222.000 | 86.752 | 61.365 | 24.043 | -4.661 | 20.201 | 24.597 | 28.318 | 29.746 |
| 97 | 114.000 | 162.000 | 148.000 | 222.000 | 86.752 | 61.365 | 24.043 | -4.661 | 20.201 | 24.597 | 28.318 | 29.746 |
| 98 | 114.000 | 162.000 | 148.000 | 220.000 | 86.752 | 56.685 | 24.043 | -3.187 | 20.201 | 25.434 | 28.318 | 28.673 |
| 99 | 114.000 | 162.000 | 148.000 | 220.000 | 86.752 | 56.685 | 24.043 | -3.187 | 20.201 | 25.434 | 28.318 | 28.673 |
| 100 | 114.000 | 160.000 | 146.000 | 218.000 | 70.124 | 59.175 | 23.202 | -3.067 | 13.761 | 24.869 | 28.318 | 28.379 |
The historical mechanics chart uses 80 official BTCUSDT two-hour candle opens from May 2021. Its generic labels count candles in the excerpt; the download retains UTC timestamps. Calculations use the 20 preceding highs and 10 preceding lows and express high, low or closing-price distance from the corresponding boundary as 10,000 × (observation / boundary − 1), in basis points. It shows indicator values only, with no simulated fills. Eight default-setting executions were checked against official next opens and their preceding channel conditions; a separate independent audit reconciled all 294 recorded default executions. Those checks verify that one trace, not every execution in the sweep. A further excluded three-setting stop control reproduced all complete main metrics at stops off/2N/4N. All 302 recorded executions of its 20/10 close/close 2N setting matched official next opens and preceding channel-or-frozen-stop conditions; 18 exits satisfied only the stop condition. This checks the observed trace, without generating trades locally. The three diagnostic evaluations are excluded from main totals.
The platform’s full-window buy-and-hold benchmark uses the first and last closes, including the 500 startup bars when the strategy holds cash. The passive controls reported here instead use the same 99% allocation, 500-bar startup, next-open entry and 0.1% cost, then hold. Eight previously recorded and independently audited controls supply those returns and are excluded from this study’s evaluation totals. The final included candle opens at 00:00 UTC on each end date. The table retains the platform’s reported maximum-drawdown metric; it does not imply tick-level path reconstruction.
Original compact exports, completion screenshots and exact source checksums are preserved privately. Audits validate Cartesian grid membership, guard exclusions, capital, candle sizes, endpoints, positive fees, finite metrics, errors, duplicates and repeat agreement. There are no locally simulated portfolio results.
The official BTCUSDT two-hour archives contain three source gaps totaling four absent candles; observed rows are used without interpolation. The direct ETHUSDT four-hour source used for the reversal traces is continuous.
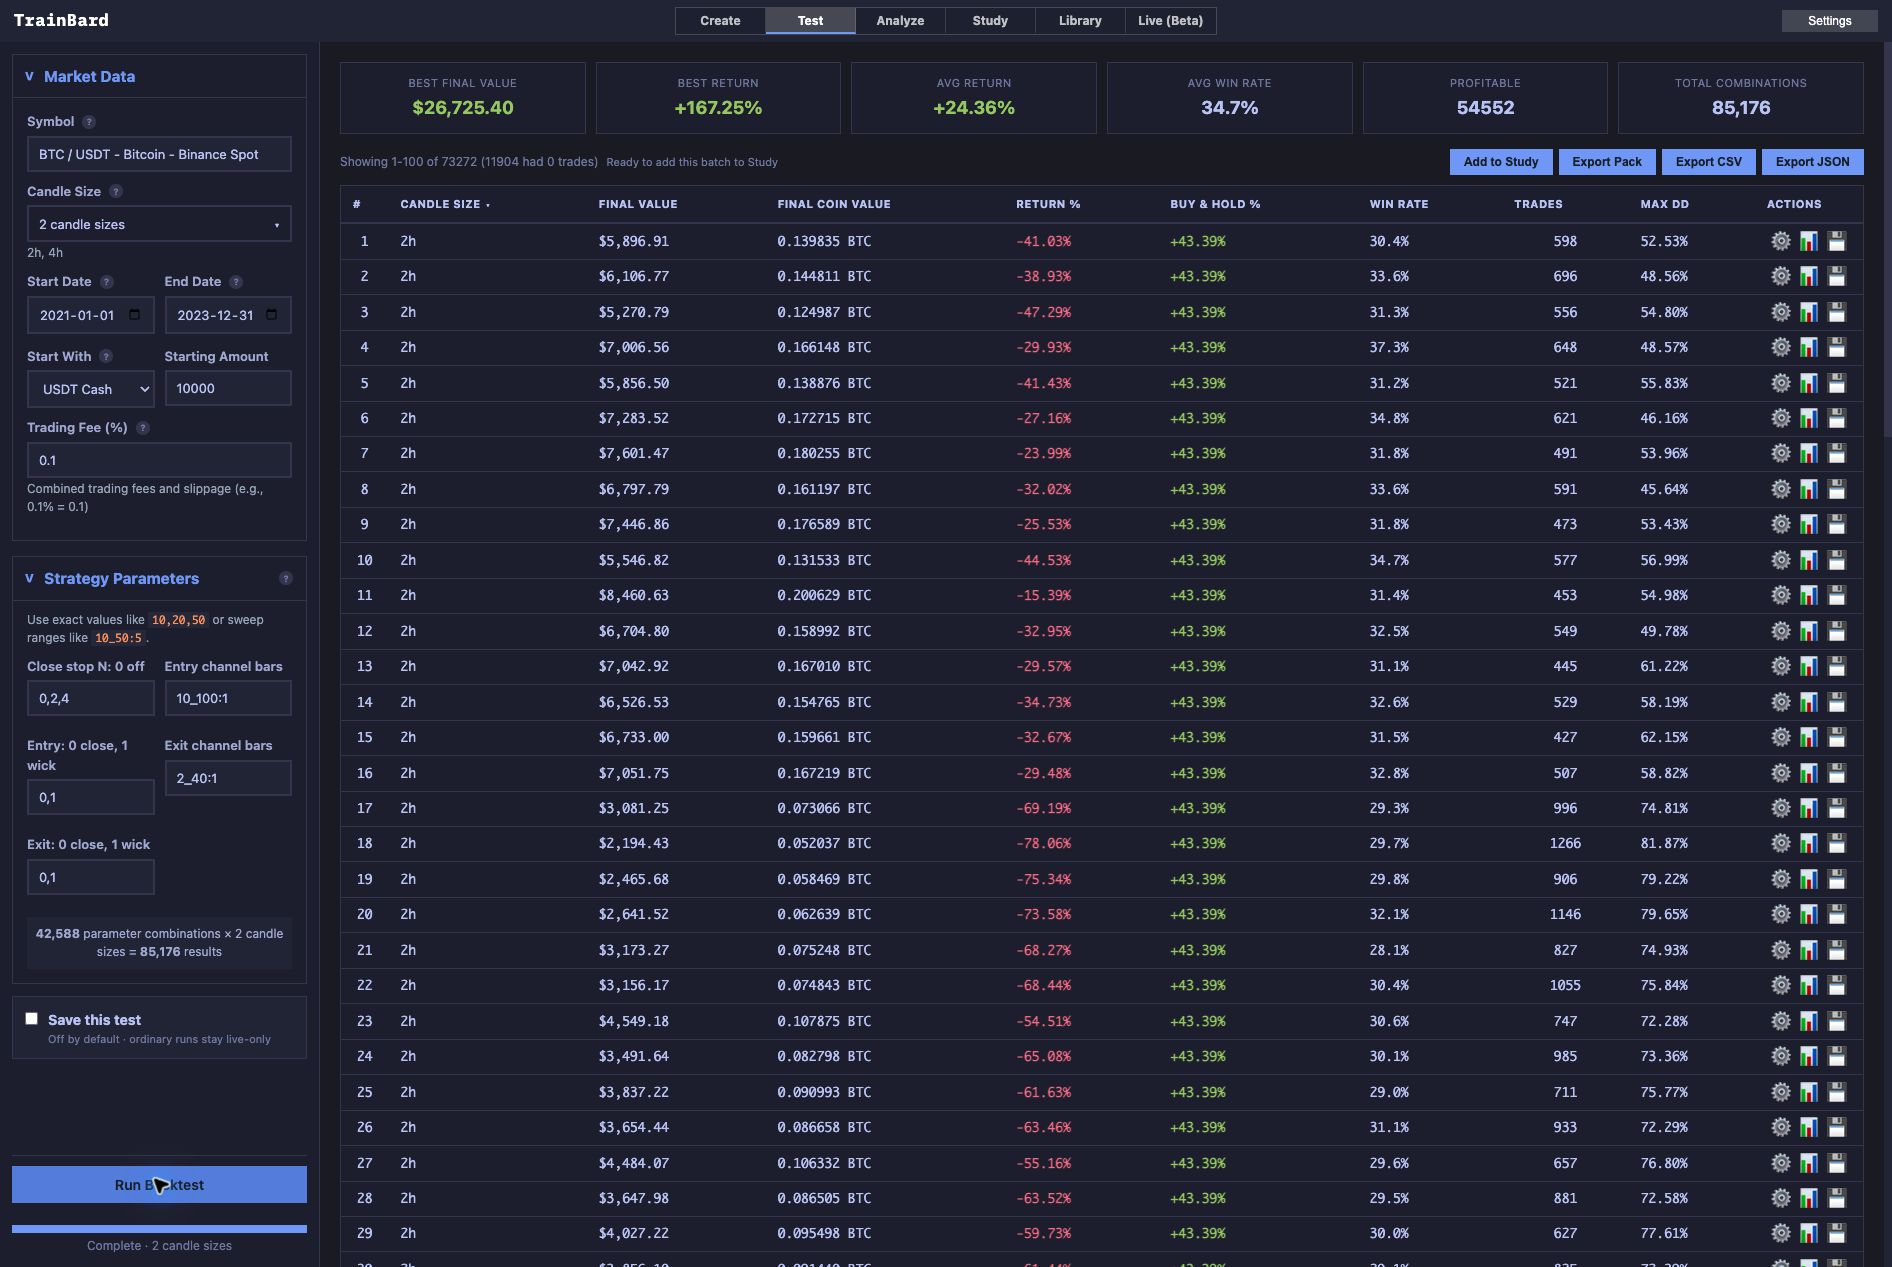
The unaltered completed-batch screenshot is the first broad BTC batch. Download the tested strategy script, completed evidence, exact study methods, neighborhood evidence and historical-chart provenance.

A separate two-setting 85/32 close-exit, 2N repeat on ETHUSDT four-hour 2021–2023 reproduced every complete main metric. Its close-entry trace has 54 recorded executions and its wick-entry trace has 49. All matched official next opens and preceding prior-channel or actual-fill/frozen-N stop conditions. The 36 official monthly four-hour archives are checksum verified and contain 6,570 continuously spaced candles. The audit compares actual recorded holding intervals and identifies 6 stop-only exit decisions where the other recorded holding has neither a channel nor a stop trigger at that close. It generates no trades or portfolio returns. Together with the 12-row smoke and three-row stop control, these two rows make 17 excluded diagnostic evaluations. Their repeats are deliberate and add no independent trials. Download the compact trace audit for checksums, counts and the observed stop-reference comparison.