Key takeaways
- Raw stochastic measures the close's position within a recent high-low range; smoothing averages recent readings, and an old range extreme expiring can move the oscillator without a new close.
- The common 14/3/3 setting has three separate choices: range length, smoothing of %K, and smoothing of %D.
- Smoothing changes crossover and exit timing. A longer %D average can make the full rule busier; fewer executions alone do not establish a better rule.
The stochastic oscillator starts with the latest close’s position within a recent high-low range. Its familiar %K and %D lines can smooth that raw reading, helping traders read momentum, identify relatively high or low readings, and define trading signals.
Across 101,952 configuration evaluations, we separated two choices that often get bundled into “slower stochastic settings”: smoothing the oscillator itself and smoothing its signal line. They change different parts of a trading rule. A quieter line also need not deliver a better result.
What does the stochastic oscillator measure?
A raw reading of 80 places the close four-fifths of the way from the window’s lowest low to its highest high. It does not mean price has risen 80%, or that there is an 80% chance of a reversal.
For a nonzero price range:
Raw %K = 100 × (close − lowest low) / (highest high − lowest low)
Smoothed %K = simple moving average of raw %K
%D = simple moving average of the chosen %K line
The high and low come from the same chosen lookback. With a range from 90 to 110 and a close of 106, raw %K is 80. A close of 94 gives 20. The current candle’s high and low belong to the range.
TradingView’s stochastic documentation describes the construction and the common 14-period range with three-period smoothing. Periods mean candles; fourteen hourly candles and fourteen daily candles describe different amounts of time.
Fast, slow, and full stochastic settings
The terminology can make two identical-looking settings mean different things:
- Fast stochastic uses raw %K and usually a three-period average for %D.
- Slow stochastic first averages raw %K over three periods, then averages that line again for %D.
- Full stochastic lets you choose the range lookback and both smoothing lengths.
The familiar 14/3/3 full setting means a fourteen-candle range, a three-candle average of raw %K, and a three-candle average of that smoothed %K. StockCharts explains the fast, slow, and full variants.
Two consecutive averages add memory. They do not convert the oscillator into a forecast, and changing %D does not change %K itself.
Common stochastic signals
20 and 80 are common oversold and overbought reference levels. For raw %K, below 20 places the current close in the bottom fifth of its recent range; above 80 places it in the top fifth. A smoothed %K averages recent range-position readings, so it can remain below 20 after the current close has left that lower fifth. A persistent trend can keep producing high or low readings.
A trader might wait for %K to recover above 20, or for %K to cross above %D while the lines are low. These are different triggers. The first compares a line with a fixed level; the second compares two moving lines and may add a level condition.
Divergence asks a different question again: does a new price extreme have a matching oscillator extreme? Our tests below do not automate divergence or reproduce George Lane’s complete method. They isolate two simple, explicit rules so changes in the settings remain interpretable.
Why stochastic can rise when the close does not
The latest close is only one part of the formula. The range can change when an older high or low leaves it.
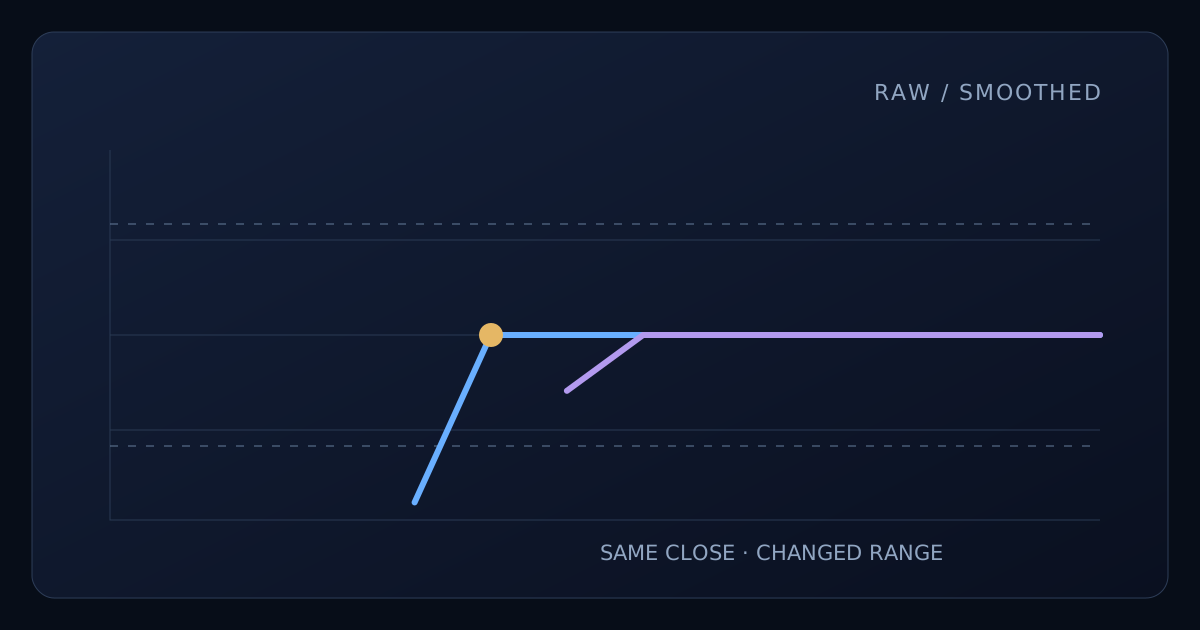
Every close is 100. Once an old high of 120 leaves the five-bar range, raw %K rises even though the close stays flat.
The value table below is available without JavaScript.
Data and calculation details
Accessible value table (14 observations)
| Observation | Price and five-bar highest high · Unchanged close | Price and five-bar highest high · Highest high | Stochastic · Raw %K | Stochastic · Three-bar %K |
|---|---|---|---|---|
| Candle 1 | 100.000 | Warming up | Warming up | Warming up |
| Candle 2 | 100.000 | Warming up | Warming up | Warming up |
| Candle 3 | 100.000 | Warming up | Warming up | Warming up |
| Candle 4 | 100.000 | Warming up | Warming up | Warming up |
| Candle 5 | 100.000 | 120.000 | 4.762 | Warming up |
| Candle 6 | 100.000 | 101.000 | 50.000 | Warming up |
| Candle 7 | 100.000 | 101.000 | 50.000 | 34.921 |
| Candle 8 | 100.000 | 101.000 | 50.000 | 50.000 |
| Candle 9 | 100.000 | 101.000 | 50.000 | 50.000 |
| Candle 10 | 100.000 | 101.000 | 50.000 | 50.000 |
| Candle 11 | 100.000 | 101.000 | 50.000 | 50.000 |
| Candle 12 | 100.000 | 101.000 | 50.000 | 50.000 |
| Candle 13 | 100.000 | 101.000 | 50.000 | 50.000 |
| Candle 14 | 100.000 | 101.000 | 50.000 | 50.000 |
Select Old high remains, then Old high expires. Every close in this constructed example is 100. While the five-candle window still contains a high of 120 and a low of 99, raw %K is about 4.76. When that old high leaves, the highest high becomes 101 and raw %K becomes 50.
Price has not rallied. The reference range has contracted around it. A three-period average spreads the change over several readings, so the smoothed oscillator catches up later.
This is arithmetic implied by a rolling range, rather than a newly discovered trading edge. It matters when a rise in stochastic is casually described as new buying pressure: sometimes part of the rise comes from the price leaving the calculation.
What changing the smoothing actually changed
Our first rule bought when %K crossed back above a lower threshold and exited when %K reached the corresponding upper threshold. With the familiar 20/80 levels, it waited for recovery above 20 and exited at 80 or higher. It skipped an entry if the same close had already reached the upper exit threshold.
The second rule bought a %K/%D upward crossover only when %K was at or below the lower threshold. It exited on a downward crossover. Here, changing %D changes both the entry comparison and the exit comparison; it does not merely make the displayed %K line calmer.
Range length 14 and entry level 20 stay fixed. Change only the smoothing of K in the threshold-recovery rule.
The value table below is available without JavaScript.
Data and calculation details
Accessible value table (8 observations)
| Observation | Recovery-rule executions · K smoothing |
|---|---|
| 1 | 588.000 |
| 2 | 475.000 |
| 3 | 371.000 |
| 4 | 309.000 |
| 5 | 269.000 |
| 6 | 239.000 |
| 7 | 195.000 |
| 8 | 169.000 |
Range length 14, K smoothing 3, and entry ceiling 20 stay fixed. Change only D smoothing in the low-zone crossover rule.
The value table below is available without JavaScript.
Data and calculation details
Accessible value table (8 observations)
| Observation | Low-zone crossover executions · D smoothing with K fixed at 3 |
|---|---|
| 2 | 704.000 |
| 3 | 522.000 |
| 4 | 410.000 |
| 5 | 322.000 |
| 6 | 274.000 |
| 7 | 226.000 |
| 8 | 184.000 |
| 9 | 158.000 |
In the displayed controlled example, increasing %K smoothing from one to three reduced recovery-rule executions from 588 to 371. In the separate crossover rule, keeping %K smoothing at three and extending %D from three to five reduced executions from 522 to 322. Both changes reduced activity in all eight historical samples. The complete curves preserve every intermediate setting.
Each buy or sell counts as one execution. These are executed trading rules, so their counts differ from the number of threshold crossings visible on an indicator chart. A signal arriving while the rule already holds a position cannot create an additional entry.
The practical distinction is to name the parameter and the decision it changes. “Use more smoothing” is incomplete. Increasing %K smoothing changes the oscillator fed into every subsequent condition. Increasing %D smoothing changes the moving reference against which %K is compared.
Can more D smoothing create more trades?
Yes, in some configurations of this rule. A separate fixed quote check used a range length of 57, K smoothing of 8, and an entry ceiling of 10. Increasing D smoothing from three to five changed recorded executions from 16 to 18.
A deliberately selected counterexample: range length 57, K smoothing 8 and entry ceiling 10 stay fixed while D smoothing changes. These settings were inspected after the broad study; this is mechanism research, not an estimate of how common the pattern is.
The value table below is available without JavaScript.
Data and calculation details
Accessible value table (8 observations)
| Observation | Recorded buy and sell executions · D smoothing |
|---|---|
| 2 | 20.000 |
| 3 | 16.000 |
| 4 | 16.000 |
| 5 | 18.000 |
| 6 | 14.000 |
| 7 | 10.000 |
| 8 | 8.000 |
| 9 | 6.000 |
We selected this case after inspecting the broad study, then froze the same eight D lengths and repeated them on the other seven historical samples. The increase appeared in one of eight samples; in the other seven, D5 produced fewer executions than D3. Every outcome remains in the download; this selected case does not estimate how often the effect occurs.
The entry requires an upward crossover while K is still at or below the ceiling. Changing D moves that comparison and also moves the downward-cross exit. Making a line smoother therefore does not guarantee fewer executions of the complete rule.
Do fewer trades mean better stochastic settings?
The broader percentage-sized sweeps produced both higher and lower returns when %D smoothing changed from three to five, with all other inputs fixed within each comparison. Reduced activity was therefore not a universal improvement. Those recorded portfolio results also include the sizing, execution, and cost assumptions described below.
Reducing activity can reduce fee exposure, but it also changes entry and exit timing, how long the strategy holds, and which moves it misses. A high winning percentage can coexist with a poor total return if the losing trades or time spent on the wrong side of a move are large enough.
The tested history does not supply one best setting for all markets. A useful next comparison holds the lookback and thresholds fixed, changes one smoothing length, and checks executions, drawdown, costs, and return together. Then repeat that exact comparison on another sample.
Reproduce the low-zone crossover test
This script implements the second rule. The downloadable companion implements the separate threshold-recovery rule. They are research adaptations with explicit entries and exits; neither is a complete stochastic trading system.
//@version=6
strategy("Stochastic low-zone crossover research", overlay=false, initial_capital=10000, default_qty_type=strategy.percent_of_equity, default_qty_value=99, process_orders_on_close=false)
length = input.int(14, "Range length", minval=2)
smooth_k = input.int(3, "K smoothing", minval=1)
smooth_d = input.int(3, "D smoothing", minval=2)
lower = input.int(20, "Entry ceiling", minval=1, maxval=49)
raw_k = ta.stoch(close, high, low, length)
k = ta.sma(raw_k, smooth_k)
d = ta.sma(k, smooth_d)
ready = bar_index >= 500
enter = ta.crossover(k, d) and k <= lower
leave = ta.crossunder(k, d)
if ready and strategy.position_size == 0 and enter
    strategy.entry("Long", strategy.long)
if ready and strategy.position_size > 0 and leave
    strategy.close("Long")
plot(k, title="K", color=color.aqua)
plot(d, title="D", color=color.orange)
hline(20, title="Common lower level")
hline(80, title="Common upper level")
Settings, accounting, and reproducibility
The main study contains 101,952 accepted valid evaluations: 11,328 threshold-recovery settings and 90,624 low-zone crossover settings, across eight historical datasets. The datasets are Binance Spot BTCUSDT and ETHUSDT, two- and four-hour candles, with the date inputs 2021-01-01–2023-12-31 and 2024-01-01–2025-12-31. Each family used its unchanged grid in every dataset. These are retrospective replications, not independent trials or blind holdouts.
Both grids use every range length from 2 through 60, %K smoothing from 1 through 8, and lower thresholds of 10, 20, or 30. The crossover grid adds %D smoothing from 2 through 9. The recovery exit is 100 minus the lower threshold; entry explicitly requires that exit condition to be false, giving the upper boundary priority on a jump across both levels. The crossover exit is any downward %K/%D cross. No irrelevant %D parameter is counted in the recovery grid.
Every main evaluation started with 10,000 USDT and remained in cash for the first 500 bars. It was long-only with no leverage, no yield on idle cash, and a requested combined fee/slippage of 0.1% per execution. The scripts request 99% equity sizing, evaluate completed-candle conditions and use next-open market orders. This requested percentage does not guarantee a persistent 1% cash reserve across repeated trades. Sizing and costs can change which later signals become recorded executions. Recorded results follow the platform’s fee and fill model; small fixed-quote controls test the activity comparisons separately. A remaining position is valued at the last close.
A selected end date includes the candle opening at 00:00 UTC on that date, rather than the entire final calendar day. Five hundred startup bars cover different elapsed time on two- and four-hour charts. The platform’s first-close to last-close holding return includes that startup and excludes trading costs. Separate recorded passive controls match startup, requested size and entry cost; the shared audit preserves them. Positive strategy return is not the same as beating either holding comparator.
Historical comparisons use the candles returned by TrainBard. An independent check against checksum-verified official monthly archives found exact agreement in the later window and small earlier-window differences, preserved in the shared source audit. Public historical indicator examples use the verified later window. No locally reconstructed trading simulation supplies any performance result.
Accepted evidence combines the completed MCP frames with the remaining frames completed through TrainBard’s web interface. Original web exports, completed count displays, screenshots and exact source checksums remain in the archive. Every missing web-export tuple must reconcile with the completed zero-execution count. Such tuples supply an execution count of zero for activity comparisons; no absent return, drawdown, win-rate or fee value is invented. Return comparisons use pairs for which both portfolio metrics were actually returned.
The main tables contain 97,212 rows with executions and 4,740 zero-execution configurations. Of these zero-execution configurations, 426 have explicit metric rows and 4,314 are omitted tuples reconciled against the completed web-interface summary. All expected tuples, original exports, completion totals, errors, capital and fee values were checked. No missing row was assigned invented trading metrics. Six initial stochastic diagnostic evaluations and two v2 executable checks are outside the main count. A preparatory recovery version lacked explicit upper-exit priority: its 1,416 broad evaluations and eight small-quote controls are retained as excluded diagnostics. All accepted recovery results use the corrected v2 script. The fixed-quote activity controls contain 128 additional evaluations, excluded from the main count. Their entry quantity is 100 divided by the signal close, making a small fixed quote budget; next-open price changes can change the actual entry value slightly.
The additional exploratory check contains 64 fixed quote evaluations, excluded from both the main count and the original 128 activity controls. The initial case was selected from ETHUSDT four-hour results for 2024-01-01–2025-12-31 after inspecting the main percentage-sized sweep. A separate recorded small-quote check verified the D3-to-D5 execution increase. We then froze range 57, K smoothing 8, entry ceiling 10 and D lengths 2–9 and repeated that exact grid in the remaining seven datasets. These are post hoc replications, not a blind holdout; nonreplications are retained.
The activity download retains all eight control datasets and identifies the displayed representative example. Its vertical axes start at zero. The main-study evidence retains paired comparisons and the exact platform metrics. The range-expiry chart is constructed indicator arithmetic, not market history or simulated trading. Source and result SHA-256 hashes are preserved in the evidence.
Download the crossover script, threshold-recovery script, fixed-quote control script, accepted study evidence, and shared execution and candle audit. Original requests, responses and full sweep tables remain in the research archive.
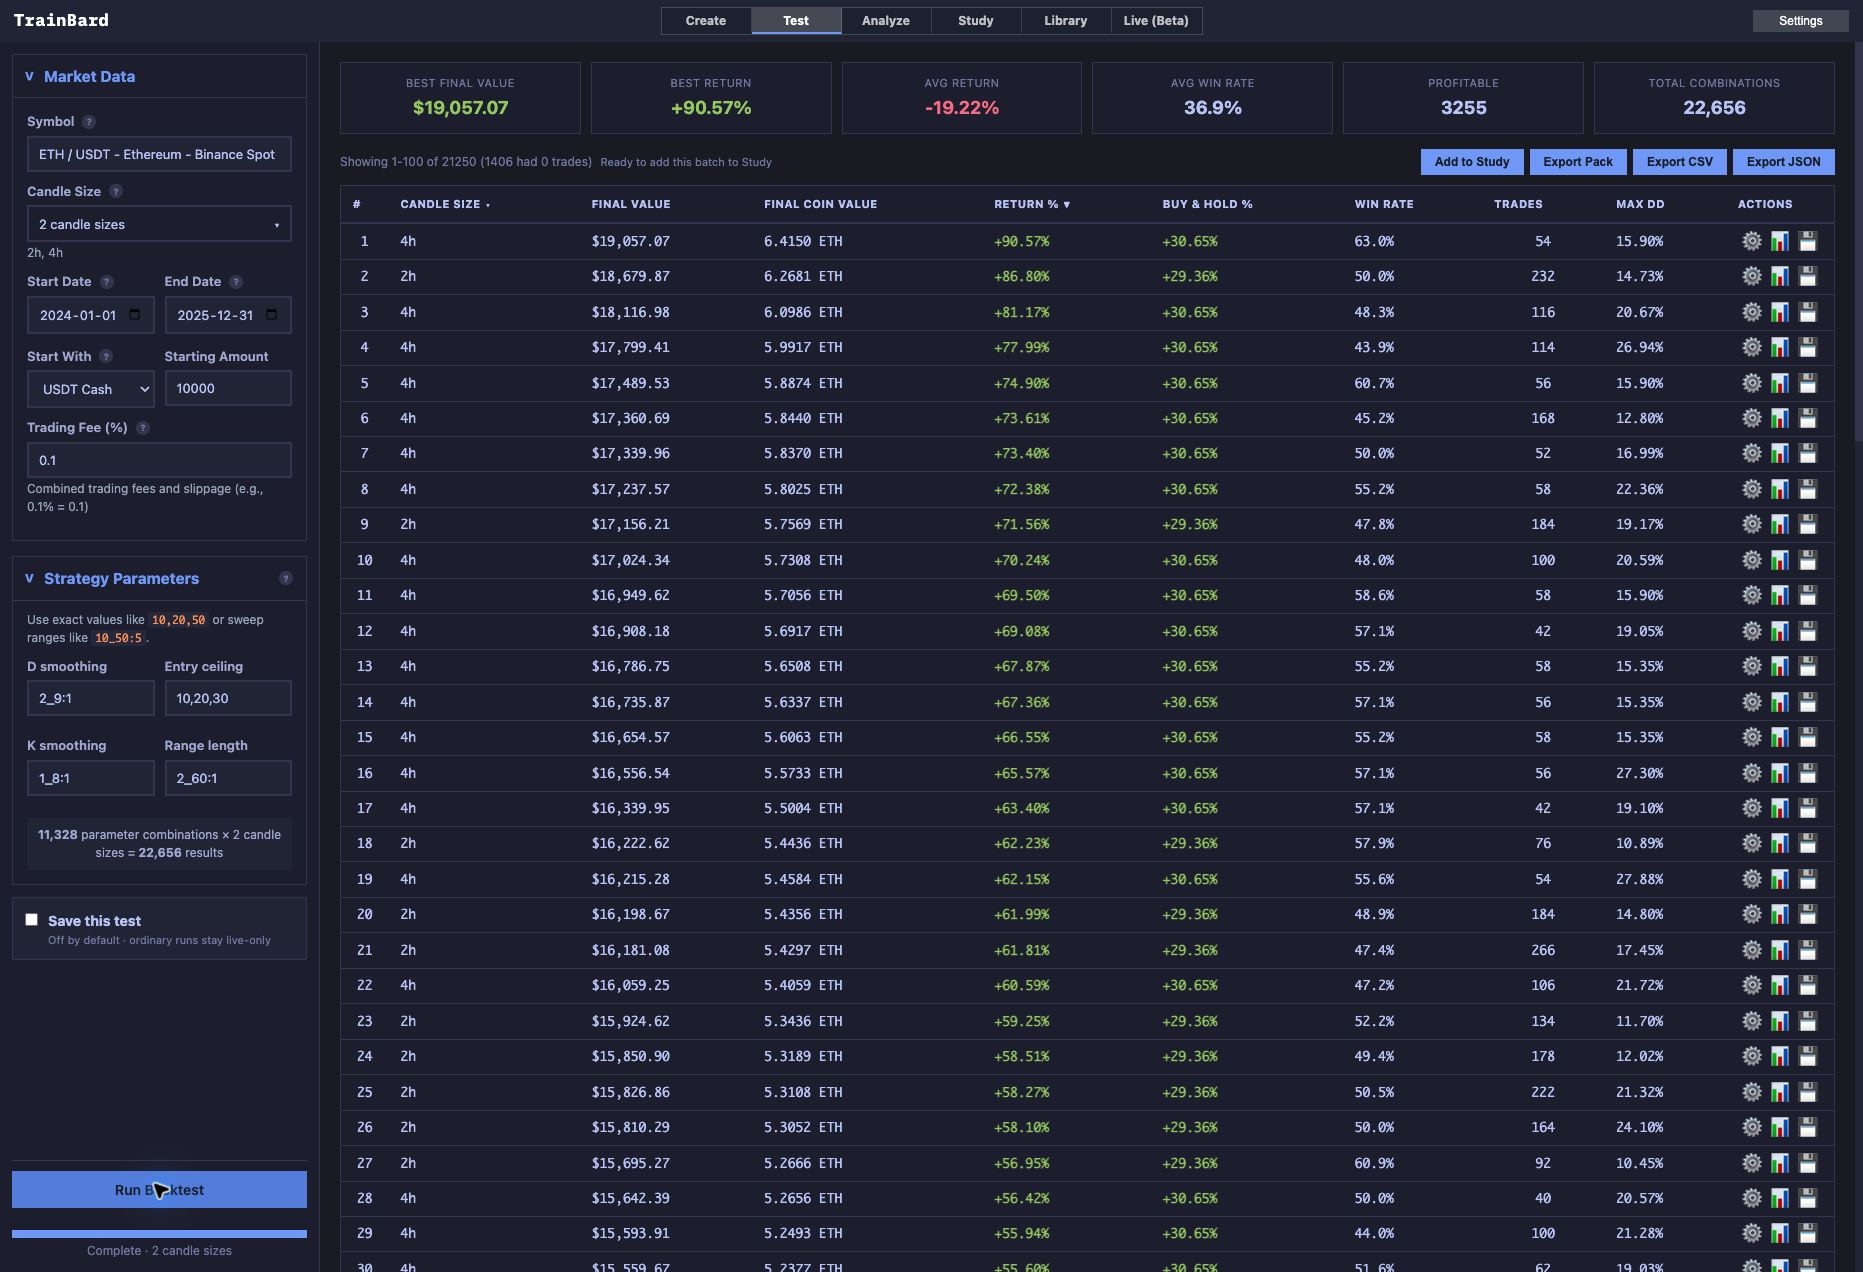
This original UI completion covers 22,656 crossover settings on the later ETHUSDT two- and four-hour frames, including 1,406 zero-execution settings reconciled with the export. The best displayed row is completion evidence, not a recommended setting.
Compare the same idea with the RSI guide and the MACD guide: the line, the trigger, and the trade each answer a different question.