Key takeaways
- RSI compares smoothed gains with losses on a 0–100 scale; high readings can persist because flat closes do not automatically pull it toward 50.
- Read the lookback together with the thresholds: longer memory and more distant levels jointly shape how often a rule can act.
- Waiting for a recovery crossing can change timing and returns without reducing transactions; the historical comparisons found no consistent advantage from confirmation.
The Relative Strength Index (RSI) compares recent price gains with recent price losses and expresses their balance on a scale from 0 to 100. Traders commonly use a 14-period RSI, with readings above 70 called overbought and readings below 30 called oversold.
Those labels describe momentum. Buying while RSI is below 30 and buying after it recovers above 30 ask for different events. Across 313,632 valid historical configuration evaluations, we examined how RSI settings and trading rules interact. We will start with the calculation, then explore the behavior behind the familiar signals.
How RSI is calculated
RSI uses an average of upward price changes and an average of downward price changes, with losses expressed as positive amounts:
RS = average gain ÷ average loss
RSI = 100 − 100 ÷ (1 + RS)

Average gain = 2, average loss = 1
RS = 2
RSI ≈ 66.7
The usual calculation uses Wilder’s smoothing. After the initial averages, each update keeps part of the previous average and adds the latest change. For a 14-period RSI:
New average gain = (13 × previous average gain + latest gain) ÷ 14
New average loss = (13 × previous average loss + latest loss) ÷ 14
An upward close contributes a gain and a zero loss; a downward close contributes a loss and a zero gain. The averages retain some influence from older changes, so RSI 14 has a different kind of memory from a simple average containing exactly 14 observations. TradingView’s RSI guide covers the indicator and its calculation.
The period follows the chart. RSI 14 on a daily chart updates from daily closes; on a two-hour chart, it updates from two-hour closes. The familiar number 14 therefore describes different market time on different charts.
Why a flat price does not automatically cool RSI
Suppose price closes unchanged. The latest gain and loss are both zero. In the calculation above, both existing averages are multiplied by 13/14.
Their ratio stays the same, so RSI stays the same. With established, nonzero averages, a flat candle does not pull the oscillator toward 50 merely because time has passed.
This helps explain why a high reading can persist. RSI measures the balance of gains and losses under its smoothing rule. A move back down through 70 requires that balance to change.
How traders read RSI signals
Several familiar interpretations appear in Fidelity’s RSI guide:
- Overbought and oversold: 70 and 30 mark customary momentum extremes. A strong trend can keep RSI near an extreme for an extended period.
- The midpoint: above 50, the smoothed gains exceed the smoothed losses; below 50, losses exceed gains. This supplies trend context.
- Recovery crossings: a rule can wait for RSI to cross back above an oversold level before buying, or back below an overbought level before selling. Schwab’s explanation discusses waiting for this return crossing.
- Divergence: price can make a higher high while RSI makes a lower high, or a lower low while RSI makes a higher low. Traders use this difference as a possible warning about momentum. Our mechanical tests below focus on levels and crossings; they do not test divergence.
“RSI is below 30” describes a state that can last several candles. “RSI has crossed back above 30” describes a transition after that state. The distinction matters when turning a chart interpretation into an entry or exit rule.
Overbought can persist while price advances
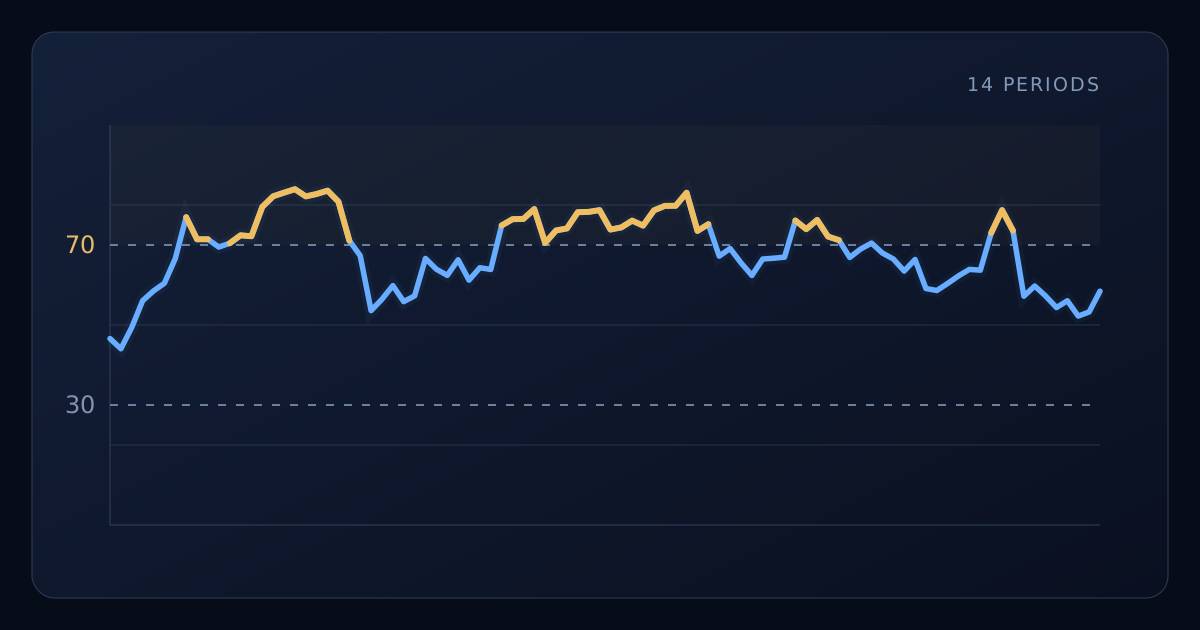
The price panel appears above RSI 14. Move the shared inspection slider to compare the same candle in both panels.
Price can keep rising while RSI remains overbought. Drag the shared inspection slider to compare the same candle in both panes.
The value table below is available without JavaScript.
Data and calculation details
Accessible value table (92 observations)
| Observation | Closing price · Close | RSI 14 · RSI 14 |
|---|---|---|
| 2025-09-28T08:00:00Z | 109,519.420 | 46.604 |
| 2025-09-28T10:00:00Z | 109,369.020 | 44.060 |
| 2025-09-28T12:00:00Z | 109,639.000 | 49.400 |
| 2025-09-28T14:00:00Z | 110,037.930 | 56.072 |
| 2025-09-28T16:00:00Z | 110,203.520 | 58.517 |
| 2025-09-28T18:00:00Z | 110,337.600 | 60.438 |
| 2025-09-28T20:00:00Z | 110,833.990 | 66.602 |
| 2025-09-28T22:00:00Z | 112,163.950 | 76.960 |
| 2025-09-29T00:00:00Z | 111,855.300 | 71.424 |
| 2025-09-29T02:00:00Z | 111,857.510 | 71.440 |
| 2025-09-29T04:00:00Z | 111,753.340 | 69.484 |
| 2025-09-29T06:00:00Z | 111,865.950 | 70.427 |
| 2025-09-29T08:00:00Z | 112,110.900 | 72.422 |
| 2025-09-29T10:00:00Z | 112,100.000 | 72.188 |
| 2025-09-29T12:00:00Z | 113,227.290 | 79.534 |
| 2025-09-29T14:00:00Z | 113,815.570 | 82.179 |
| 2025-09-29T16:00:00Z | 114,043.910 | 83.092 |
| 2025-09-29T18:00:00Z | 114,265.550 | 83.952 |
| 2025-09-29T20:00:00Z | 114,176.730 | 82.149 |
| 2025-09-29T22:00:00Z | 114,311.960 | 82.756 |
| 2025-09-30T00:00:00Z | 114,500.310 | 83.593 |
| 2025-09-30T02:00:00Z | 114,376.390 | 80.814 |
| 2025-09-30T04:00:00Z | 113,904.000 | 71.107 |
| 2025-09-30T06:00:00Z | 113,699.230 | 67.332 |
| 2025-09-30T08:00:00Z | 112,781.970 | 53.603 |
| 2025-09-30T10:00:00Z | 113,055.010 | 56.450 |
| 2025-09-30T12:00:00Z | 113,404.530 | 59.846 |
| 2025-09-30T14:00:00Z | 113,106.160 | 55.842 |
| 2025-09-30T16:00:00Z | 113,246.110 | 57.286 |
| 2025-09-30T18:00:00Z | 114,359.990 | 66.634 |
| 2025-09-30T20:00:00Z | 114,161.000 | 63.942 |
| 2025-09-30T22:00:00Z | 114,048.930 | 62.412 |
| 2025-10-01T00:00:00Z | 114,549.990 | 66.294 |
| 2025-10-01T02:00:00Z | 114,176.920 | 61.224 |
| 2025-10-01T04:00:00Z | 114,569.840 | 64.319 |
| 2025-10-01T06:00:00Z | 114,539.020 | 63.888 |
| 2025-10-01T08:00:00Z | 116,412.100 | 74.893 |
| 2025-10-01T10:00:00Z | 116,789.580 | 76.451 |
| 2025-10-01T12:00:00Z | 116,806.960 | 76.523 |
| 2025-10-01T14:00:00Z | 117,423.730 | 78.986 |
| 2025-10-01T16:00:00Z | 116,768.070 | 70.517 |
| 2025-10-01T18:00:00Z | 117,439.530 | 73.635 |
| 2025-10-01T20:00:00Z | 117,554.960 | 74.141 |
| 2025-10-01T22:00:00Z | 118,594.990 | 78.202 |
| 2025-10-02T00:00:00Z | 118,617.370 | 78.281 |
| 2025-10-02T02:00:00Z | 118,733.990 | 78.714 |
| 2025-10-02T04:00:00Z | 118,377.340 | 73.863 |
| 2025-10-02T06:00:00Z | 118,489.760 | 74.398 |
| 2025-10-02T08:00:00Z | 118,849.990 | 76.089 |
| 2025-10-02T10:00:00Z | 118,765.730 | 74.844 |
| 2025-10-02T12:00:00Z | 119,621.200 | 78.662 |
| 2025-10-02T14:00:00Z | 119,910.780 | 79.781 |
| 2025-10-02T16:00:00Z | 119,917.520 | 79.807 |
| 2025-10-02T18:00:00Z | 120,836.490 | 83.070 |
| 2025-10-02T20:00:00Z | 120,150.100 | 73.516 |
| 2025-10-02T22:00:00Z | 120,529.350 | 75.212 |
| 2025-10-03T00:00:00Z | 119,875.720 | 67.220 |
| 2025-10-03T02:00:00Z | 120,225.890 | 69.114 |
| 2025-10-03T04:00:00Z | 119,920.400 | 65.556 |
| 2025-10-03T06:00:00Z | 119,640.210 | 62.384 |
| 2025-10-03T08:00:00Z | 120,300.000 | 66.495 |
| 2025-10-03T10:00:00Z | 120,334.500 | 66.700 |
| 2025-10-03T12:00:00Z | 120,374.730 | 66.954 |
| 2025-10-03T14:00:00Z | 122,258.050 | 76.128 |
| 2025-10-03T16:00:00Z | 122,073.250 | 73.958 |
| 2025-10-03T18:00:00Z | 122,660.990 | 76.274 |
| 2025-10-03T20:00:00Z | 122,306.570 | 72.110 |
| 2025-10-03T22:00:00Z | 122,232.000 | 71.228 |
| 2025-10-04T00:00:00Z | 121,865.210 | 66.898 |
| 2025-10-04T02:00:00Z | 122,243.990 | 68.994 |
| 2025-10-04T04:00:00Z | 122,522.700 | 70.476 |
| 2025-10-04T06:00:00Z | 122,324.080 | 67.983 |
| 2025-10-04T08:00:00Z | 122,208.780 | 66.512 |
| 2025-10-04T10:00:00Z | 121,973.260 | 63.490 |
| 2025-10-04T12:00:00Z | 122,385.420 | 66.370 |
| 2025-10-04T14:00:00Z | 121,791.310 | 59.130 |
| 2025-10-04T16:00:00Z | 121,747.370 | 58.620 |
| 2025-10-04T18:00:00Z | 121,959.250 | 60.392 |
| 2025-10-04T20:00:00Z | 122,190.670 | 62.291 |
| 2025-10-04T22:00:00Z | 122,391.000 | 63.904 |
| 2025-10-05T00:00:00Z | 122,377.720 | 63.710 |
| 2025-10-05T02:00:00Z | 123,776.220 | 73.025 |
| 2025-10-05T04:00:00Z | 125,127.990 | 78.713 |
| 2025-10-05T06:00:00Z | 124,713.630 | 73.591 |
| 2025-10-05T08:00:00Z | 123,020.500 | 57.208 |
| 2025-10-05T10:00:00Z | 123,464.640 | 59.740 |
| 2025-10-05T12:00:00Z | 123,161.390 | 57.249 |
| 2025-10-05T14:00:00Z | 122,803.170 | 54.366 |
| 2025-10-05T16:00:00Z | 123,057.050 | 56.055 |
| 2025-10-05T18:00:00Z | 122,591.790 | 52.239 |
| 2025-10-05T20:00:00Z | 122,729.990 | 53.257 |
| 2025-10-05T22:00:00Z | 123,482.310 | 58.449 |
RSI remained above 70 for 20 consecutive closes in the highlighted stretch, while price ended higher. The high reading described sustained upward momentum throughout that episode.
We selected a long stretch above 70 to make persistence visible. It illustrates how a high reading can last; it does not estimate how long the next one will continue. The chart shows calculated indicator values without trade markers. Exact source and selection details are folded below.
Waiting for a crossing changes timing
A common exit sells when RSI rises above 70. Another waits until RSI crosses back below 70. The second rule allows an overbought stretch to continue, but that extra time can help or hurt.
We compared these exits after the same recovery entry: RSI crosses above the lower level and remains at or below the upper level. Every other setting stays fixed. One execution means one buy or one sell.
In one historical dataset, 3,651 of 3,701 matched pairs recorded the same execution count when both rules had at least one buy and one sell. Their returns still differed. The same broad pattern appeared across all eight historical datasets: at least 97% of these active pairs had matching counts. Changing when a position closes can alter its outcome without reducing the number of transactions.
Waiting for the downward crossing improved some historical results and worsened others. Confirmation changes the timing of a trade; it did not supply a consistent advantage across the tested comparisons.
Read the lookback together with the levels
Longer RSI periods smooth changes more heavily. Whether that produces a quiet trading rule also depends on how far its thresholds sit from 50.
For a rule that buys below the lower level and sells above the upper level, one historical sample produced 91 executions with 30/70 levels and 275 with 40/60, using RSI 14 in both cases. The lookback stayed the same; moving the decision levels closer to 50 changed how often the rule could act.
Keep the entry and exit levels fixed while changing only RSI length. The 40/60 levels sit closer to the middle than 30/70.
The value table below is available without JavaScript.
Data and calculation details
Accessible value table (94 observations)
| Observation | Recorded executions · 30/70 levels | Recorded executions · 40/60 levels |
|---|---|---|
| 7 | 309.000 | 672.000 |
| 8 | 251.000 | 550.000 |
| 9 | 213.000 | 455.000 |
| 10 | 177.000 | 407.000 |
| 11 | 139.000 | 373.000 |
| 12 | 113.000 | 349.000 |
| 13 | 99.000 | 309.000 |
| 14 | 91.000 | 275.000 |
| 15 | 79.000 | 255.000 |
| 16 | 73.000 | 235.000 |
| 17 | 65.000 | 209.000 |
| 18 | 63.000 | 193.000 |
| 19 | 57.000 | 181.000 |
| 20 | 55.000 | 165.000 |
| 21 | 45.000 | 149.000 |
| 22 | 39.000 | 141.000 |
| 23 | 35.000 | 129.000 |
| 24 | 31.000 | 123.000 |
| 25 | 29.000 | 113.000 |
| 26 | 29.000 | 103.000 |
| 27 | 29.000 | 99.000 |
| 28 | 27.000 | 93.000 |
| 29 | 24.000 | 81.000 |
| 30 | 22.000 | 81.000 |
| 31 | 20.000 | 79.000 |
| 32 | 18.000 | 75.000 |
| 33 | 16.000 | 71.000 |
| 34 | 16.000 | 71.000 |
| 35 | 16.000 | 68.000 |
| 36 | 16.000 | 66.000 |
| 37 | 12.000 | 66.000 |
| 38 | 10.000 | 64.000 |
| 39 | 10.000 | 63.000 |
| 40 | 10.000 | 63.000 |
| 41 | 10.000 | 59.000 |
| 42 | 10.000 | 57.000 |
| 43 | 10.000 | 53.000 |
| 44 | 8.000 | 51.000 |
| 45 | 8.000 | 47.000 |
| 46 | 8.000 | 45.000 |
| 47 | 8.000 | 45.000 |
| 48 | 8.000 | 42.000 |
| 49 | 8.000 | 42.000 |
| 50 | 8.000 | 38.000 |
| 51 | 6.000 | 38.000 |
| 52 | 6.000 | 38.000 |
| 53 | 6.000 | 36.000 |
| 54 | 6.000 | 36.000 |
| 55 | 6.000 | 34.000 |
| 56 | 6.000 | 32.000 |
| 57 | 6.000 | 32.000 |
| 58 | 6.000 | 30.000 |
| 59 | 6.000 | 30.000 |
| 60 | 6.000 | 30.000 |
| 61 | 6.000 | 28.000 |
| 62 | 6.000 | 28.000 |
| 63 | 6.000 | 26.000 |
| 64 | 6.000 | 26.000 |
| 65 | 6.000 | 26.000 |
| 66 | 6.000 | 26.000 |
| 67 | 6.000 | 26.000 |
| 68 | 4.000 | 24.000 |
| 69 | 4.000 | 24.000 |
| 70 | 4.000 | 24.000 |
| 71 | 4.000 | 24.000 |
| 72 | 4.000 | 24.000 |
| 73 | 4.000 | 22.000 |
| 74 | 4.000 | 20.000 |
| 75 | 4.000 | 20.000 |
| 76 | 4.000 | 20.000 |
| 77 | 4.000 | 20.000 |
| 78 | 4.000 | 20.000 |
| 79 | 4.000 | 20.000 |
| 80 | 4.000 | 20.000 |
| 81 | 4.000 | 20.000 |
| 82 | 4.000 | 18.000 |
| 83 | 4.000 | 18.000 |
| 84 | 4.000 | 18.000 |
| 85 | 4.000 | 16.000 |
| 86 | 4.000 | 16.000 |
| 87 | 4.000 | 16.000 |
| 88 | 4.000 | 16.000 |
| 89 | 4.000 | 16.000 |
| 90 | 4.000 | 16.000 |
| 91 | 4.000 | 14.000 |
| 92 | 4.000 | 14.000 |
| 93 | 4.000 | 14.000 |
| 94 | 2.000 | 14.000 |
| 95 | 2.000 | 14.000 |
| 96 | 2.000 | 12.000 |
| 97 | 2.000 | 12.000 |
| 98 | 2.000 | 12.000 |
| 99 | 2.000 | 12.000 |
| 100 | 0.000 | 12.000 |
The chart displays lengths 7–100 for legibility; the complete tested grid runs from 2 to 100. Each point holds the entry and exit levels fixed and changes RSI length. A longer lookback can make a distant threshold rare; bringing the levels toward the middle changes the opportunity set again. These observations do not imply that every one-period increase must reduce activity. Compare the two threshold choices at the same lookback; the only difference between them is the entry and exit levels.
Study design, execution assumptions, and reproducibility
The fixed grid spans Binance Spot BTCUSDT and ETHUSDT, two-hour and four-hour candles, and the exact UI windows 2021-01-01 to 2023-12-31 and 2024-01-01 to 2025-12-31. We explored the earlier window, then kept the grid and final script unchanged for the later window and Ethereum replication. These comparisons are retrospective, with no prospective or live validation.
The price/RSI worked example uses official Binance Spot BTCUSDT two-hour candles. We selected the longest consecutive RSI 14 > 70 stretch in the 2024–2025 dataset: 20 closes, with candle-open labels from 2025-10-01T08:00Z through 2025-10-02T22:00Z. RSI is separately calculated with Wilder smoothing from earlier candles; the source and calculation record preserves the selection method and source checksums. The neutral “Candle” labels in the interactive display map to unchanged timestamps in the chart data.
The activity chart foregrounds Sample 1; the complete chart-data download retains both samples. Sample 1 is BTCUSDT two-hour data from 2021-01-01 to 2023-12-31; Sample 2 is BTCUSDT two-hour data from 2024-01-01 to 2025-12-31. The samples have different durations. The 91-versus-275 example comes from Sample 1; the corresponding Sample 2 counts are 68 and 184. The 3,651-of-3,701 exit-pair comparison also comes from Sample 2. The all-eight-dataset coverage statement uses the same active-pair definition in every asset, candle size and window.
For completeness, the familiar RSI 14 with 30/70 levels produced these default-setting returns after the same recovery entry:
| BTC two-hour window | Exit above 70 | Exit crossing below 70 | Passive from the same startup |
|---|---|---|---|
| 2021–2023 | 89 executions; −30.92% | 89 executions; −19.74% | −10.95% |
| 2024–2025 | 64 executions; +47.63% | 64 executions; +25.80% | +82.55% |
Waiting for the downward crossing improved this default rule’s earlier result and worsened its later result. Both versions lagged the startup-matched passive comparison shown here.
| Rule | Buy condition | Sell condition |
|---|---|---|
| Level | RSI below the lower level | RSI above the upper level |
| Recovery entry | RSI crosses above the lower level, while at or below the upper level | RSI above the upper level |
| Recovery entry and exit | Same recovery entry | RSI crosses below the upper level |
| Strength | RSI above the upper level | RSI below the lower level |
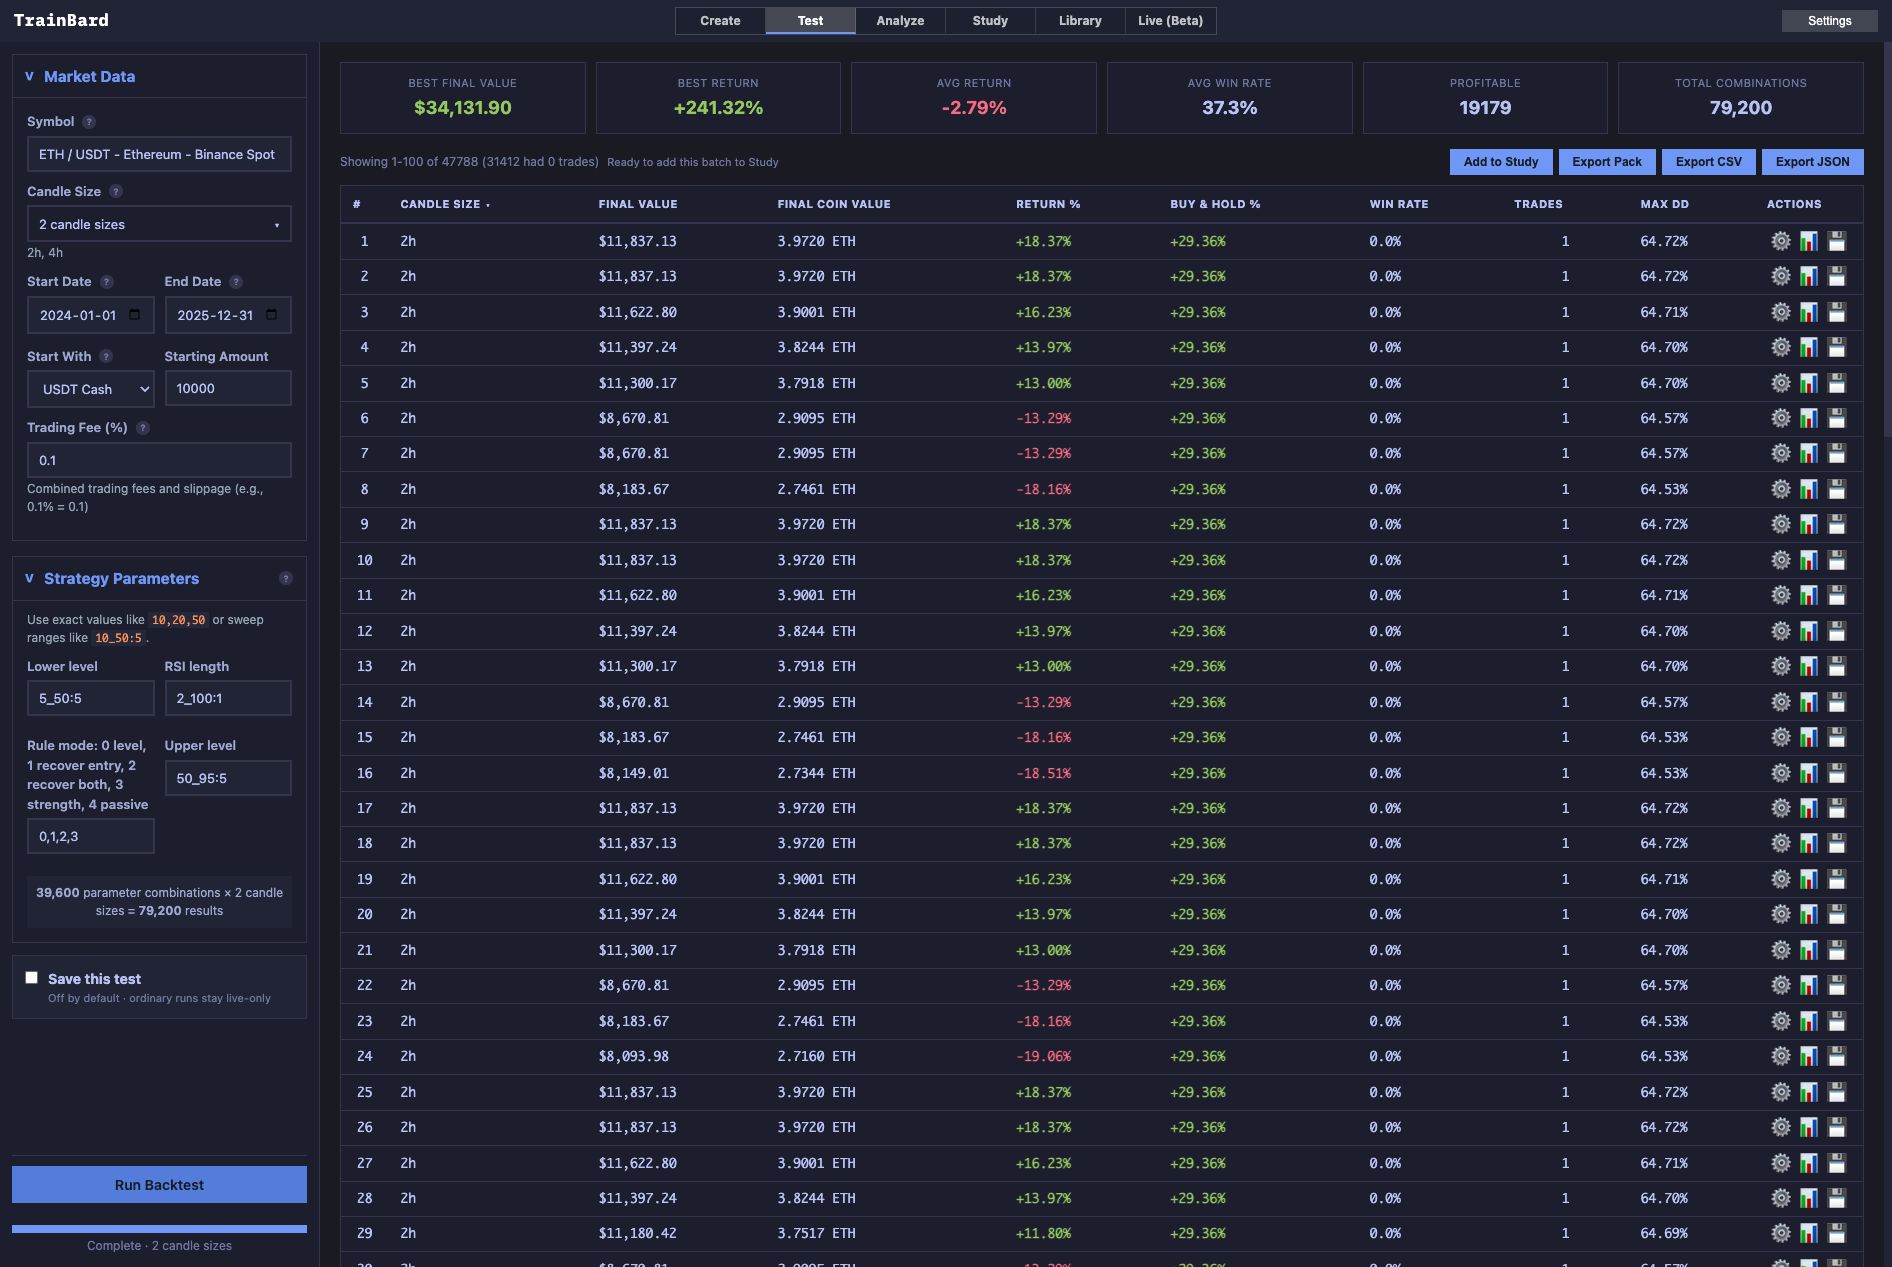
Each rule uses RSI lengths 2–100 in steps of 1, lower levels 5–50 in steps of 5, and upper levels 50–95 in steps of 5. The lower level must be below the upper level. Each frame therefore contains 39,204 valid configurations. The equal-level 50/50 tuples are invalid and remain separate from valid settings that make no trades. Across the eight frames, the completed main study contains 313,632 valid evaluations: 194,692 exported rows with trades and 118,940 valid settings without trades. The 3,168 invalid tuples are excluded from that count. All four joint batches completed with no exported error rows or duplicate parameter tuples.
Every test starts with 10,000 USDT, takes long positions using 99% of equity, and retains a 1% cash reserve. The requested combined fee and slippage is 0.1% per buy or sell execution. Signals use completed candles with next-open execution. Exits take priority; an entry requires a flat position. A common 500-bar startup inside each window prevents early orders, so the startup spans more calendar time on four-hour candles.
The passive comparison uses the same startup, sizing, cost, and next-open convention, then holds through the endpoint without a terminal sale. It is different from the platform’s full-window first-close-to-last-close benchmark. The UI end date includes the candle opening at 00:00 UTC on that date, rather than every candle in that calendar day.
A completed UI total and zero-trade count must reconcile the complete Cartesian grid before omitted valid tuples are counted as zero executions. Paired comparisons distinguish those inactive settings from pairs in which both rules record a buy and a sell. Related settings and overlapping market candles are not independent observations.
We also preserved small execution controls and an earlier full-allocation run outside the main count. A passive control showed that retaining cash avoided a delayed initial fill seen with 100% allocation. A recorded short-period exception still produced a small difference in execution counts between the two exit rules. The count findings describe the platform’s recorded results; they are not a mathematical guarantee that the rules execute identical cycles.
The exact tested Pine script, compact measurement and source record, and completed batch screenshot accompany the article. The measurement file includes all eight frame summaries, the complete 2–100 activity profiles for the two displayed threshold pairs, the separate passive baselines, and raw export checksums. Original exports and recorded diagnostic traces remain in the research archive.
These tests cover the stated crypto markets and chart intervals. Daily candles, other asset classes, divergence rules, short positions, leverage, and live execution remain outside this study.
For other ways to measure momentum, compare the Stochastic Oscillator and CCI. Related reading: simple moving averages, MACD, and Bollinger Bands.