Key takeaways
- SAR can keep approaching its retained extreme while the acceleration factor stays unchanged; starting acceleration, increment, and cap perform different jobs.
- A higher cap can change trade timing without changing the number of executions; in one complete recorded comparison, only five execution locations changed.
- Some higher caps produced identical recorded trades, while waiting for extra confirmation did not consistently improve historical returns.
Parabolic SAR places a trailing level below price during an upward leg and above price during a downward leg. SAR stands for Stop and Reverse. Its familiar dots give traders a simple way to discuss trend direction, exits, and potential reversals.
The settings deserve a closer look. Across 175,000 completed historical configuration evaluations, we varied starting acceleration, acceleration increment, maximum acceleration, and entry confirmation. One useful finding was easy to miss in a results table: raising the cap changed the timing of a few trades while leaving the execution count unchanged. Raising it further then produced exactly the same recorded trades.
How Parabolic SAR works
J. Welles Wilder introduced the Parabolic System in New Concepts in Technical Trading Systems, alongside other familiar technical tools. The publisher’s description lists the system among the book’s original concepts.
During an upward leg, SAR moves toward the highest high retained from that leg, called the extreme point, or EP. The core update is:
Next SAR = current SAR + AF × (EP − current SAR)
AF is the acceleration factor. If SAR is 90, EP is 100, and AF is 0.02, the next unbounded value is 90.20. If the extreme and AF remain unchanged, the following value is 90.396.
The complete calculation also bounds the level using recent candle ranges and resets its state on a reversal. For a downward leg, the retained extreme is the lowest low. TradingView’s SAR documentation explains these mechanics and its implementation choices.
What the .02 / .02 / .20 settings mean
The customary defaults contain three separate controls:
| Control | Default | What it controls |
|---|---|---|
| Starting acceleration | 0.02 | The factor used when a new leg begins. |
| Acceleration increment | 0.02 | The amount added when that leg makes a fresh extreme. |
| Maximum acceleration | 0.20 | The ceiling on the factor after those increases. |
The factor does not increase automatically on every candle. Fresh extremes cause the increments. Even with no new extreme, an existing positive factor can keep moving SAR toward the retained extreme, subject to the range bounds.
The cap limits AF. It does not set a maximum price level for the SAR dots.
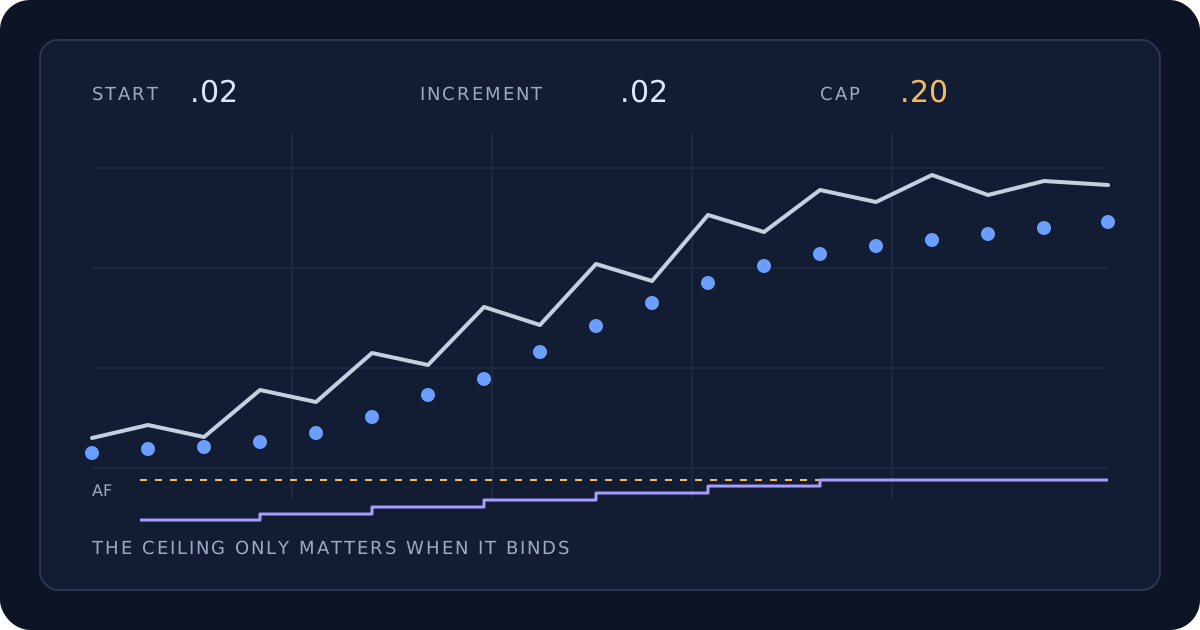
SAR can keep tightening without a fresh high
In this selected historical episode, the upward leg went 44 updates without a fresh extreme or an increase in AF. SAR nevertheless advanced toward the retained high. Inspect the same candle in the price and acceleration panels.
The extreme point and acceleration stay fixed in the highlighted stretch, while SAR keeps approaching that extreme. Inspect the same candle in both panels.
The value table below is available without JavaScript.
Data and calculation details
Accessible value table (69 observations)
| Observation | Price, SAR and the retained extreme · Close | Price, SAR and the retained extreme · SAR | Price, SAR and the retained extreme · Retained extreme | Acceleration factor · AF |
|---|---|---|---|---|
| 2024-02-28T06:00:00Z | 58,241.100 | 56,691.850 | 58,379.570 | 0.180 |
| 2024-02-28T08:00:00Z | 59,300.010 | 56,894.160 | 59,487.880 | 0.200 |
| 2024-02-28T10:00:00Z | 58,941.110 | 57,053.020 | 59,494.060 | 0.200 |
| 2024-02-28T12:00:00Z | 60,454.770 | 57,541.228 | 60,800.000 | 0.200 |
| 2024-02-28T14:00:00Z | 60,966.220 | 58,192.982 | 61,360.000 | 0.200 |
| 2024-02-28T16:00:00Z | 61,358.600 | 64,000.000 | 58,700.000 | 0.020 |
| 2024-02-28T18:00:00Z | 60,951.110 | 64,000.000 | 58,700.000 | 0.020 |
| 2024-02-28T20:00:00Z | 60,550.460 | 64,000.000 | 58,700.000 | 0.020 |
| 2024-02-28T22:00:00Z | 62,432.100 | 63,894.000 | 58,700.000 | 0.020 |
| 2024-02-29T00:00:00Z | 61,376.070 | 63,790.120 | 58,700.000 | 0.020 |
| 2024-02-29T02:00:00Z | 61,561.330 | 63,688.318 | 58,700.000 | 0.020 |
| 2024-02-29T04:00:00Z | 62,540.910 | 63,588.551 | 58,700.000 | 0.020 |
| 2024-02-29T06:00:00Z | 62,707.170 | 58,700.000 | 63,676.350 | 0.020 |
| 2024-02-29T08:00:00Z | 62,686.390 | 58,799.527 | 63,676.350 | 0.020 |
| 2024-02-29T10:00:00Z | 62,936.020 | 58,897.063 | 63,676.350 | 0.020 |
| 2024-02-29T12:00:00Z | 62,931.660 | 58,992.649 | 63,676.350 | 0.020 |
| 2024-02-29T14:00:00Z | 62,768.020 | 59,086.323 | 63,676.350 | 0.020 |
| 2024-02-29T16:00:00Z | 60,982.350 | 59,178.124 | 63,676.350 | 0.020 |
| 2024-02-29T18:00:00Z | 61,600.000 | 59,268.088 | 63,676.350 | 0.020 |
| 2024-02-29T20:00:00Z | 61,374.940 | 59,356.254 | 63,676.350 | 0.020 |
| 2024-02-29T22:00:00Z | 61,130.980 | 59,442.655 | 63,676.350 | 0.020 |
| 2024-03-01T00:00:00Z | 61,214.350 | 59,527.329 | 63,676.350 | 0.020 |
| 2024-03-01T02:00:00Z | 61,105.910 | 59,610.310 | 63,676.350 | 0.020 |
| 2024-03-01T04:00:00Z | 61,312.010 | 59,691.631 | 63,676.350 | 0.020 |
| 2024-03-01T06:00:00Z | 61,434.000 | 59,771.325 | 63,676.350 | 0.020 |
| 2024-03-01T08:00:00Z | 62,129.150 | 59,849.425 | 63,676.350 | 0.020 |
| 2024-03-01T10:00:00Z | 61,863.720 | 59,925.964 | 63,676.350 | 0.020 |
| 2024-03-01T12:00:00Z | 62,457.980 | 60,000.972 | 63,676.350 | 0.020 |
| 2024-03-01T14:00:00Z | 61,263.990 | 60,074.479 | 63,676.350 | 0.020 |
| 2024-03-01T16:00:00Z | 61,909.980 | 60,146.517 | 63,676.350 | 0.020 |
| 2024-03-01T18:00:00Z | 62,215.500 | 60,217.113 | 63,676.350 | 0.020 |
| 2024-03-01T20:00:00Z | 62,520.470 | 60,286.298 | 63,676.350 | 0.020 |
| 2024-03-01T22:00:00Z | 62,387.900 | 60,354.099 | 63,676.350 | 0.020 |
| 2024-03-02T00:00:00Z | 62,030.010 | 60,420.544 | 63,676.350 | 0.020 |
| 2024-03-02T02:00:00Z | 62,307.450 | 60,485.660 | 63,676.350 | 0.020 |
| 2024-03-02T04:00:00Z | 62,006.550 | 60,549.474 | 63,676.350 | 0.020 |
| 2024-03-02T06:00:00Z | 62,011.850 | 60,612.012 | 63,676.350 | 0.020 |
| 2024-03-02T08:00:00Z | 61,843.060 | 60,673.298 | 63,676.350 | 0.020 |
| 2024-03-02T10:00:00Z | 61,826.320 | 60,733.359 | 63,676.350 | 0.020 |
| 2024-03-02T12:00:00Z | 61,803.690 | 60,792.219 | 63,676.350 | 0.020 |
| 2024-03-02T14:00:00Z | 61,771.200 | 60,849.902 | 63,676.350 | 0.020 |
| 2024-03-02T16:00:00Z | 61,761.110 | 60,906.431 | 63,676.350 | 0.020 |
| 2024-03-02T18:00:00Z | 62,114.770 | 60,961.829 | 63,676.350 | 0.020 |
| 2024-03-02T20:00:00Z | 61,898.730 | 61,016.120 | 63,676.350 | 0.020 |
| 2024-03-02T22:00:00Z | 61,987.280 | 61,069.324 | 63,676.350 | 0.020 |
| 2024-03-03T00:00:00Z | 61,795.530 | 61,121.465 | 63,676.350 | 0.020 |
| 2024-03-03T02:00:00Z | 61,931.090 | 61,172.562 | 63,676.350 | 0.020 |
| 2024-03-03T04:00:00Z | 61,900.000 | 61,222.638 | 63,676.350 | 0.020 |
| 2024-03-03T06:00:00Z | 61,598.000 | 61,271.712 | 63,676.350 | 0.020 |
| 2024-03-03T08:00:00Z | 61,715.050 | 61,319.805 | 63,676.350 | 0.020 |
| 2024-03-03T10:00:00Z | 61,831.100 | 61,320.000 | 63,676.350 | 0.020 |
| 2024-03-03T12:00:00Z | 62,393.860 | 61,367.127 | 63,676.350 | 0.020 |
| 2024-03-03T14:00:00Z | 62,164.630 | 61,413.311 | 63,676.350 | 0.020 |
| 2024-03-03T16:00:00Z | 62,570.010 | 61,458.572 | 63,676.350 | 0.020 |
| 2024-03-03T18:00:00Z | 62,730.000 | 61,502.928 | 63,676.350 | 0.020 |
| 2024-03-03T20:00:00Z | 62,827.110 | 61,546.396 | 63,676.350 | 0.020 |
| 2024-03-03T22:00:00Z | 63,113.970 | 61,588.995 | 63,676.350 | 0.020 |
| 2024-03-04T00:00:00Z | 63,512.410 | 61,630.742 | 64,268.240 | 0.040 |
| 2024-03-04T02:00:00Z | 63,458.720 | 61,736.242 | 64,268.240 | 0.040 |
| 2024-03-04T04:00:00Z | 63,358.000 | 61,837.522 | 64,268.240 | 0.040 |
| 2024-03-04T06:00:00Z | 64,066.620 | 61,934.751 | 64,300.000 | 0.060 |
| 2024-03-04T08:00:00Z | 65,290.290 | 62,076.666 | 65,555.000 | 0.080 |
| 2024-03-04T10:00:00Z | 65,230.000 | 62,354.933 | 65,555.000 | 0.080 |
| 2024-03-04T12:00:00Z | 65,111.210 | 62,610.938 | 65,646.110 | 0.100 |
| 2024-03-04T14:00:00Z | 66,451.650 | 62,914.455 | 66,580.290 | 0.120 |
| 2024-03-04T16:00:00Z | 66,858.740 | 63,354.355 | 67,524.990 | 0.140 |
| 2024-03-04T18:00:00Z | 67,405.260 | 63,938.244 | 67,524.990 | 0.140 |
| 2024-03-04T20:00:00Z | 67,404.860 | 64,440.389 | 67,770.000 | 0.160 |
| 2024-03-04T22:00:00Z | 68,245.710 | 64,973.126 | 68,499.000 | 0.180 |
This is an indicator calculation, with no simulated trades. We selected the longest qualifying stretch by duration to make the mechanism visible. It does not predict the length of the next stretch.
The distinction helps explain the cap. Giving AF permission to rise above 0.20 has no effect while the calculation continues using a smaller factor. Even when the factor changes, the recent-range bound can restrict how far the final level moves.
How traders use the buy and sell signals
A simple SAR strategy treats a change from above price to below price as a bullish reversal, and the opposite change as bearish. TradingView’s SAR strategy describes a system that alternates between long and short positions.
Our executable comparison uses a long-or-cash adaptation. It buys after the required number of consecutive bullish SAR candles, then sells when the bullish state ends. Signals use completed candles, with market execution on the following eligible open. This differs from an intrabar order placed at a SAR stop and from an always-reversing long/short system.
The usual weakness remains relevant: repeated reversals can be costly in a choppy range. A directional level alone does not establish trend strength. A separate trend-strength filter is a familiar extension; the experiments here isolate SAR’s own controls and entry confirmation.
A higher cap can change timing without adding trades
We held starting acceleration and increment at 0.02, with immediate bullish-state entry. In one matched historical comparison, raising the cap from 0.20 to 0.25 left the total at 462 executions. One execution means one buy or one sell.
The returns still changed: −31.79% versus −27.33%. Both results were negative.
We inspected the complete recorded trade lists. Only five execution locations differed when matched by their position in the list. The first changed purchase arrived two candles earlier with the higher cap. A strategy can keep the same number of buys and sells while buying or selling at different moments.
Changing only the cap can leave the execution count unchanged while changing returns. In this recorded sample, both curves then flatten from .25 through .50.
The value table below is available without JavaScript.
Data and calculation details
Accessible value table (7 observations)
| Observation | Recorded executions · Executions | Recorded return (%) · Return (%) |
|---|---|---|
| 0.10 | 426.000 | -15.474 |
| 0.15 | 450.000 | -24.608 |
| 0.20 | 462.000 | -31.789 |
| 0.25 | 462.000 | -27.332 |
| 0.30 | 462.000 | -27.332 |
| 0.40 | 462.000 | -27.332 |
| 0.50 | 462.000 | -27.332 |
In the same sample, caps 0.25, 0.30, 0.40, and 0.50 shared the displayed curve values. A focused repeat at 0.25 and 0.50 went further: all 462 recorded execution rows matched in every displayed cell.
The broader grid also contained many outcome plateaus. Raising only the cap from 0.40 to 0.50 kept all seven exported summary fields identical in 80% to 100% of matched settings within each historical sample. The exact field list and comparison counts are in the methods below.
These are conditional plateaus in recorded outcomes. They do not establish that 0.25 is a universally sufficient cap, or that indicator values were identical on every candle. Matching summaries alone also do not prove matching trade lists; the complete trace check above applies to that one fixed configuration. The full parameter comparisons are available in the evidence download.
Confirmation reduces opportunities and changes the price paid
Waiting for an extra bullish candle rejects short bullish episodes and delays surviving entries. That can reduce activity while worsening the outcome.
For example, at the familiar defaults in one historical sample, increasing confirmation from one to two bullish candles reduced executions from 963 to 921. Recorded return changed from −80.03% to −81.47%. Fewer transactions did not rescue that example.
Across the tested parameter comparisons, confirmation helped some settings and hurt others. Its benefit must cover the cost of entering later. Counting the signals it removes is only part of that assessment.
Is there a best Parabolic SAR setting?
The defaults are a useful reference. Our tests do not justify a single setting for every trading environment.
Read the controls together. A low increment may leave a large cap unused; a faster increment can reach it sooner. Once an earlier reversal resets the calculation, the future extreme and acceleration history can also differ. Increasing a number therefore does not provide a simple ranking of complete trading outcomes.
A useful comparison holds the other controls fixed, checks nearby settings, and inspects recorded trades when summary metrics conceal a change. A plateau can save needless fine tuning; a sharp isolated winner calls for more scrutiny.
For related entry and exit questions, compare the Alligator strategy and Turtle channel strategy. To repeat these SAR comparisons, open TrainBard with the downloadable script and hold the other controls fixed while changing one setting.
Copy the strategy script
Copy this tested long-or-cash adaptation into your editor. It starts with the familiar 0.02 / 0.02 / 0.20 settings and one bullish candle for entry. Set the study’s combined trading cost to 0.1% per execution in your backtest settings. The tested SAR calculation convention is documented below.
//@version=6
strategy("Parabolic SAR Lab: acceleration and confirmation", overlay=true, initial_capital=10000, default_qty_type=strategy.percent_of_equity, default_qty_value=99, process_orders_on_close=false)

sar_start = input.float(0.02, "Starting acceleration", minval=0.002, maxval=0.05, step=0.002)
sar_step = input.float(0.02, "Acceleration increment", minval=0.002, maxval=0.05, step=0.002)
sar_max = input.float(0.2, "Acceleration cap", minval=0.1, maxval=0.5, step=0.05)
confirm_bars = input.int(1, "Consecutive bullish bars", minval=1, maxval=5)

sar_value = ta.sar(sar_start, sar_step, sar_max)
bullish = close > sar_value
bearish = close <= sar_value
bullish_age = ta.barssince(bearish)
valid = sar_start < sar_max and sar_step <= sar_max and not na(sar_value) and bar_index >= 500
enter_long = valid and bullish and bullish_age >= confirm_bars
exit_long = valid and not bullish

plot(sar_value, "Parabolic SAR", color=color.blue)

if exit_long and strategy.position_size > 0
    strategy.close("Long")
if enter_long and not exit_long and strategy.position_size == 0
    strategy.entry("Long", strategy.long)
What we tested, and how to reproduce it
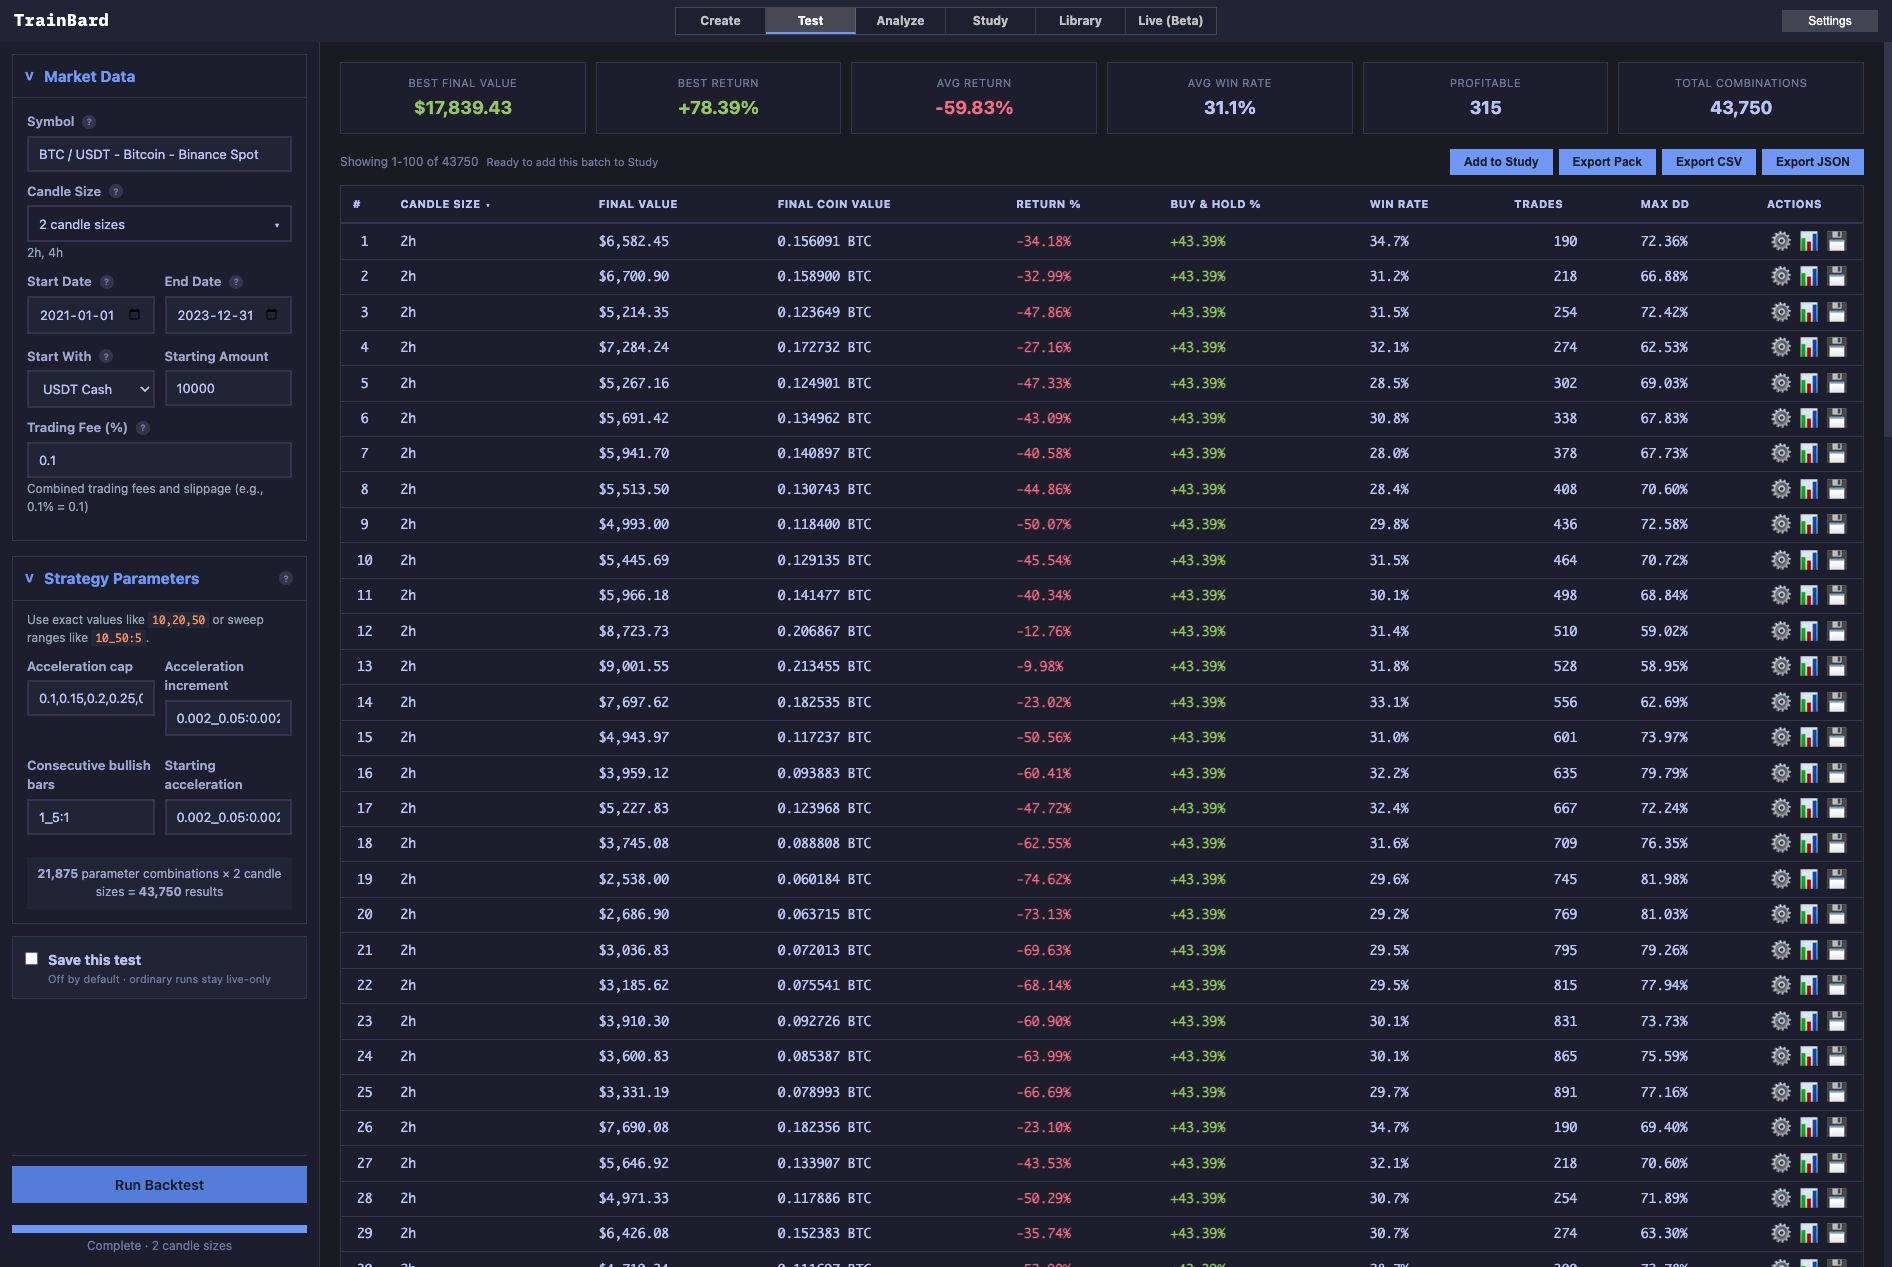
The main study contains four completed joint-candle batches: 175,000 requested, valid, and exported traded configurations across eight datasets.
Main samples use Binance Spot BTCUSDT and ETHUSDT with two-hour and four-hour candles. Both symbols were tested in the exact UI windows 2021-01-01 to 2023-12-31 and 2024-01-01 to 2025-12-31. Every dataset uses the same unchanged 21,875-setting grid:
- Starting acceleration: 0.002–0.050, in steps of 0.002 — 25 choices.
- Increment: the same 25 choices.
- Cap: 0.10, 0.15, 0.20, 0.25, 0.30, 0.40, 0.50 — seven choices.
- Consecutive bullish candles required for entry: one through five.
All relationships are valid: starting acceleration is below the cap and increment does not exceed it. No missing, zero-trade, duplicate, or error rows were found in the completed main exports. These are related historical configuration evaluations, not independent experiments or prospective validation.
The fixed execution frame is 10,000 USDT starting cash, 99% equity allocation with a cash reserve, and a Trading Fee setting of 0.1% for combined trading costs. Trading begins after 500 candles of startup. The script admits one long position, checks its flat/holding state explicitly, and uses next-bar market execution. It defines bullish as close above SAR and waits for the selected number of consecutive bullish closes. Every variant retains the same exit when that condition ends. No leverage, short positions, pyramiding, or intrabar SAR stop fills are tested.
The main exports contain 315 profitable settings in the first BTC batch, 2,494 in the first ETH batch, 6,773 in the later BTC batch, and 11,680 in the later ETH batch. That context matters when interpreting a selected example. The first BTC four-hour search winner — start 0.006, increment 0.002, cap 0.10, confirmation five — was frozen for subsequent comparisons before other main frames were opened. It remains an exploratory selection, not a recommended optimum.
The five-row default smoke and three-row cap trace diagnostic are excluded from the headline count. Every diagnostic row exactly repeats its corresponding main-grid metrics. The cap 0.20/0.25/0.50 diagnostic uses BTCUSDT four-hour candles and the earlier window. Each full UI trade table contains 462 executions. For 0.20 versus 0.25, the first differing BUY is ordinal 169: 2022-03-06T04:00Z at 39,300.53 versus 2022-03-05T20:00Z at 39,433.71. The compact recorded-trace evidence preserves the comparison and source hashes. Every displayed execution price in all three lists was independently checked against official candle opens.
The tested SAR implementation applies the previous-two-candle range bound before checking the current candle for reversal. Our independent indicator calculation reconciles all 963 recorded default execution directions in a two-hour diagnostic and one directly inspected plotted SAR value. This supports that tested convention; exact cross-platform parity or reproduction of every detail in Wilder’s original system is not claimed. The actual editor source was compared against the frozen script, retaining indentation and every nonblank line.
The indicator chart separately uses checksum-verified official BTCUSDT two-hour candles for 2024–2025. Its selected stretch spans candle-open labels 2024-02-29T06:00Z through 2024-03-03T22:00Z. Across 44 updates, the retained extreme stays 63,676.35 and AF stays 0.02, while SAR moves from 58,700.00 to 61,588.9953. Selection is by the longest post-startup bullish run with unchanged extreme/AF and strictly rising SAR, with the earliest tie chosen. It uses no trade returns. The neutral display labels preserve the original timestamps in the download. Source files, checksums, and calculation provenance remain available.
The cap-response chart shows only B001 BTCUSDT four-hour results, fixing start/increment 0.02 and confirmation one. Its seven cap settings come directly from the archived main export. The evidence download includes complete frame identities, all cap profiles, matched comparisons, fixed representatives, source hashes, and matching-start passive references. The displayed chart’s raw-row extraction map remains in the research archive. Platform drawdown is retained as a reported metric; it is not treated as an independently reconstructed risk measure.
The cap 0.40→0.50 comparisons match every other control, giving 3,125 complete pairs per dataset. Exact equality is checked on seven unrounded exported fields: totalReturn, finalValue, totalTrades, winRate, maxDrawdownPct, totalFees, and finalCoinAmount. Between 2,500 and 3,125 pairs per dataset match all seven, producing the 80%–100% range. These comparisons reuse the main evaluations and add no backtest count. They establish summary equality; complete trade-list equality was checked only for the three-row diagnostic described above.
The tested Pine Script is downloadable. Full sweep exports and the complete recorded trade lists are preserved in the research archive; this article publishes compact evidence rather than the entire result tables.