Key takeaways
- OBV adds or subtracts an entire candle's volume according to the direction of its close; it discards the size of that price change.
- OBV's cumulative starting level is arbitrary. Changes and relative comparisons survive a constant shift, while raw zero crossings do not.
- At a 20-bar lookback, volume-weighted flow and equal closing-direction votes had strictly opposite signs on about 5–11% of checked candles in the historical samples.
On-Balance Volume, usually shortened to OBV, adds volume after an up close and subtracts it after a down close. The resulting line summarizes volume signed by closing direction.
Our 129,887 configuration evaluations compare that volume weighting with an equal vote for each candle’s direction. At a 20-bar lookback, the two measures had strictly opposite signs on about 5–11% of checked candles across the historical samples. Volume confirmation can materially disagree with a simple tally of up and down closes.
How is OBV calculated?
The update has three cases:
Close above the previous close: add this bar's volume
Close below the previous close: subtract this bar's volume
Close unchanged:                leave OBV unchanged
TradingView’s OBV documentation describes that cumulative construction and its conventional uses for trend confirmation and divergence.
Suppose three candles have volumes of 100, 300, and 200. Their closes move up, down, and up. OBV’s net change is 100 − 300 + 200 = 0, although two of the three closes rose.
A move from 100 to 100.01 and a move from 100 to 110 both add the entire candle’s volume when they are up closes. OBV preserves the sign of the price change and discards its magnitude. It also does not identify the aggressor of each transaction: assigning all an up candle’s volume a positive sign is a calculation convention.
What does a rising OBV mean?
A rise means more volume has accumulated on up closes than on down closes over that portion of the line. Traders compare that direction with price, look for range breaks, or add a smoothing average.
It is a description of the signed-volume history. Price can still decline afterward. One large-volume candle can dominate the line, and a different venue or volume feed can produce a different path.
Calling OBV a leading indicator expresses the hope that a change in volume behavior comes before a price turn. The calculation itself supplies no guarantee that it will lead the next move.
Divergence means price and OBV fail to confirm one another’s highs, lows, or direction. A precise divergence strategy needs defined pivots, confirmation delays, and an entry rule. Our tested rules use rolling signed flow; they do not test discretionary chart divergence.
Why OBV’s zero level is arbitrary
If a chart starts OBV at zero and another starts it at one million, their curves differ by a constant. The signed-volume changes are identical.
That shift changes whether the raw OBV line lies above or below zero. It does not change these comparisons:
OBV now − OBV N bars ago

OBV now − its moving average
The constant cancels. A raw zero crossing therefore needs a deliberately fixed starting convention before it has a stable interpretation. An OBV-to-average comparison or rolling change asks a question that survives that shift.
This is an identity in the calculation, not a discovery established by counting more backtests.
How much difference does volume weighting make?
To compare volume with an equal vote, we put both measures on a shared scale:
Volume-weighted flow = rolling OBV change ÷ total volume
Equal-vote flow       = (up closes − down closes) ÷ number of bars
Both lie between −1 and +1 when volume is positive. The first gives a larger vote to a candle with more volume. The second gives each closing direction the same weight.
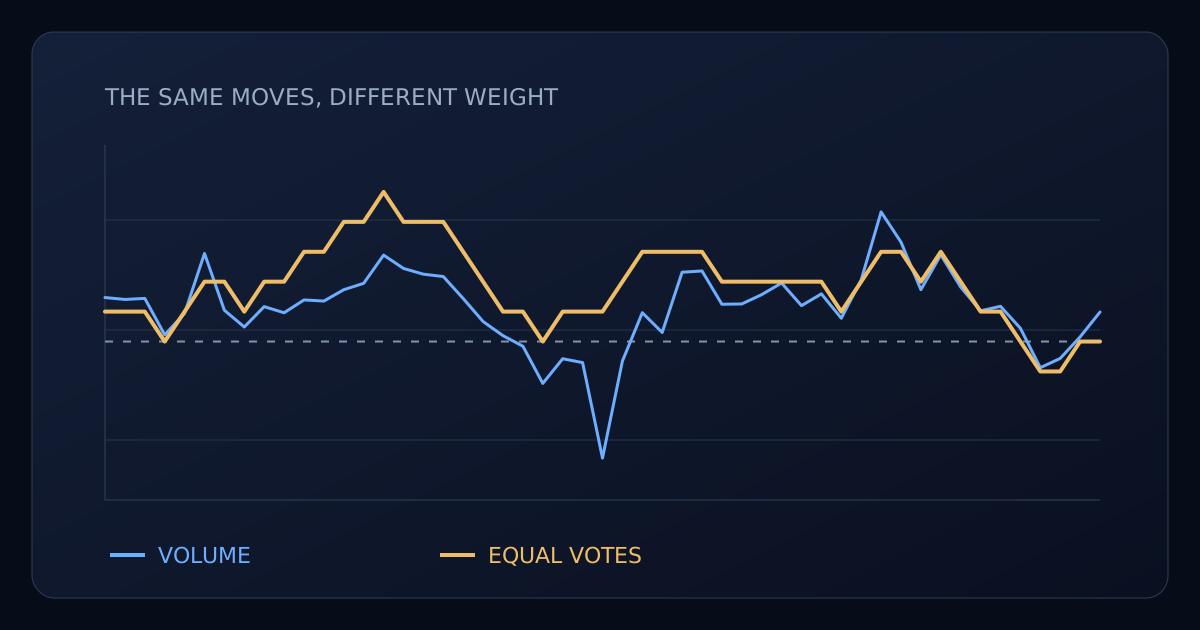
A selected episode where total signed volume and an equal vote of closing directions point to opposite sides of zero.
The value table below is available without JavaScript.
Data and calculation details
Accessible value table (51 observations)
| Observation | Closing price · Close | 20-bar normalized signed flow · Volume weighting | 20-bar normalized signed flow · Equal votes |
|---|---|---|---|
| 2025-09-05T02:00:00Z | 111,311.770 | 0.147 | 0.100 |
| 2025-09-05T04:00:00Z | 111,574.500 | 0.141 | 0.100 |
| 2025-09-05T06:00:00Z | 112,954.320 | 0.144 | 0.100 |
| 2025-09-05T08:00:00Z | 112,303.870 | 0.022 | 0.000 |
| 2025-09-05T10:00:00Z | 112,354.000 | 0.094 | 0.100 |
| 2025-09-05T12:00:00Z | 113,084.160 | 0.294 | 0.200 |
| 2025-09-05T14:00:00Z | 110,716.820 | 0.104 | 0.200 |
| 2025-09-05T16:00:00Z | 110,608.180 | 0.049 | 0.100 |
| 2025-09-05T18:00:00Z | 111,614.540 | 0.117 | 0.200 |
| 2025-09-05T20:00:00Z | 110,605.010 | 0.096 | 0.200 |
| 2025-09-05T22:00:00Z | 110,659.990 | 0.139 | 0.300 |
| 2025-09-06T00:00:00Z | 110,867.700 | 0.135 | 0.300 |
| 2025-09-06T02:00:00Z | 111,082.220 | 0.173 | 0.400 |
| 2025-09-06T04:00:00Z | 110,714.000 | 0.195 | 0.400 |
| 2025-09-06T06:00:00Z | 110,825.600 | 0.289 | 0.500 |
| 2025-09-06T08:00:00Z | 110,695.060 | 0.244 | 0.400 |
| 2025-09-06T10:00:00Z | 110,781.020 | 0.225 | 0.400 |
| 2025-09-06T12:00:00Z | 110,936.820 | 0.217 | 0.400 |
| 2025-09-06T14:00:00Z | 110,384.150 | 0.144 | 0.300 |
| 2025-09-06T16:00:00Z | 110,157.410 | 0.067 | 0.200 |
| 2025-09-06T18:00:00Z | 110,038.410 | 0.020 | 0.100 |
| 2025-09-06T20:00:00Z | 110,201.000 | -0.016 | 0.100 |
| 2025-09-06T22:00:00Z | 110,187.970 | -0.140 | 0.000 |
| 2025-09-07T00:00:00Z | 110,546.660 | -0.058 | 0.100 |
| 2025-09-07T02:00:00Z | 110,629.150 | -0.070 | 0.100 |
| 2025-09-07T04:00:00Z | 110,649.440 | -0.389 | 0.100 |
| 2025-09-07T06:00:00Z | 110,753.420 | -0.065 | 0.200 |
| 2025-09-07T08:00:00Z | 111,115.980 | 0.096 | 0.300 |
| 2025-09-07T10:00:00Z | 111,292.130 | 0.030 | 0.300 |
| 2025-09-07T12:00:00Z | 111,214.620 | 0.232 | 0.300 |
| 2025-09-07T14:00:00Z | 111,329.990 | 0.236 | 0.300 |
| 2025-09-07T16:00:00Z | 110,962.830 | 0.125 | 0.200 |
| 2025-09-07T18:00:00Z | 111,259.990 | 0.126 | 0.200 |
| 2025-09-07T20:00:00Z | 111,050.140 | 0.157 | 0.200 |
| 2025-09-07T22:00:00Z | 111,137.340 | 0.196 | 0.200 |
| 2025-09-08T00:00:00Z | 110,890.570 | 0.120 | 0.200 |
| 2025-09-08T02:00:00Z | 111,052.110 | 0.159 | 0.200 |
| 2025-09-08T04:00:00Z | 111,027.160 | 0.078 | 0.100 |
| 2025-09-08T06:00:00Z | 111,280.390 | 0.206 | 0.200 |
| 2025-09-08T08:00:00Z | 112,094.990 | 0.433 | 0.300 |
| 2025-09-08T10:00:00Z | 112,052.430 | 0.332 | 0.300 |
| 2025-09-08T12:00:00Z | 111,906.550 | 0.173 | 0.200 |
| 2025-09-08T14:00:00Z | 112,631.750 | 0.290 | 0.300 |
| 2025-09-08T16:00:00Z | 112,214.400 | 0.182 | 0.200 |
| 2025-09-08T18:00:00Z | 112,097.310 | 0.103 | 0.100 |
| 2025-09-08T20:00:00Z | 112,326.450 | 0.118 | 0.100 |
| 2025-09-08T22:00:00Z | 112,065.230 | 0.044 | 0.000 |
| 2025-09-09T00:00:00Z | 111,364.730 | -0.087 | -0.100 |
| 2025-09-09T02:00:00Z | 111,708.000 | -0.056 | -0.100 |
| 2025-09-09T04:00:00Z | 112,200.000 | 0.015 | 0.000 |
| 2025-09-09T06:00:00Z | 112,991.110 | 0.099 | 0.000 |
Select Volume and votes disagree. The same twenty closing directions produce opposing signs because their volumes differ.
Across all eight historical samples, strict opposite signs covered about 5–11% of post-startup candles at that lookback. Ties in the equal-vote measure are counted separately; the percentage does not include them. This distinction matters because equal votes can sum to zero while signed volume points either way.
The observations share overlapping windows. They describe how often the calculations disagreed in these samples, not independent predictions.
Why some threshold changes make no difference
An equal vote produces a discrete score. With two candles and no unchanged closes, the possible averages are −1, 0, and +1.
A positive entry threshold of 0.10 or 0.80 then selects the same +1 state. Searching more numbers between them does not create a different signal. Volume weighting can distinguish mixed-direction pairs because unequal volumes need not cancel. With unchanged closes, zero votes introduce extra possible scores: at two bars, one up close and one unchanged close average +0.5.
The backtests compare strength entries above a positive flow threshold with fade entries below the negative threshold. Both exit when the flow returns across zero.
One fixed rule and historical sample, changing only the displayed setting and line comparison. Each buy/sell is one execution.
The value table below is available without JavaScript.
Data and calculation details
Accessible value table (99 observations)
| Observation | Executions by lookback (bars) · Volume weighting | Executions by lookback (bars) · Equal votes |
|---|---|---|
| 2 | 3,756.000 | 2,162.000 |
| 4 | 2,466.000 | 1,492.000 |
| 6 | 1,847.000 | 1,209.000 |
| 8 | 1,355.000 | 979.000 |
| 10 | 1,051.000 | 541.000 |
| 12 | 853.000 | 513.000 |
| 14 | 709.000 | 476.000 |
| 16 | 620.000 | 452.000 |
| 18 | 516.000 | 414.000 |
| 20 | 442.000 | 242.000 |
| 22 | 392.000 | 248.000 |
| 24 | 328.000 | 232.000 |
| 26 | 316.000 | 224.000 |
| 28 | 290.000 | 224.000 |
| 30 | 248.000 | 150.000 |
| 32 | 240.000 | 160.000 |
| 34 | 210.000 | 154.000 |
| 36 | 184.000 | 164.000 |
| 38 | 176.000 | 156.000 |
| 40 | 166.000 | 98.000 |
| 42 | 150.000 | 100.000 |
| 44 | 144.000 | 96.000 |
| 46 | 140.000 | 96.000 |
| 48 | 130.000 | 94.000 |
| 50 | 122.000 | 68.000 |
| 52 | 120.000 | 62.000 |
| 54 | 116.000 | 68.000 |
| 56 | 104.000 | 62.000 |
| 58 | 94.000 | 62.000 |
| 60 | 88.000 | 46.000 |
| 62 | 90.000 | 46.000 |
| 64 | 84.000 | 52.000 |
| 66 | 76.000 | 52.000 |
| 68 | 76.000 | 52.000 |
| 70 | 70.000 | 38.000 |
| 72 | 64.000 | 38.000 |
| 74 | 70.000 | 44.000 |
| 76 | 68.000 | 42.000 |
| 78 | 60.000 | 48.000 |
| 80 | 58.000 | 34.000 |
| 82 | 50.000 | 32.000 |
| 84 | 46.000 | 34.000 |
| 86 | 48.000 | 34.000 |
| 88 | 40.000 | 34.000 |
| 90 | 40.000 | 28.000 |
| 92 | 40.000 | 28.000 |
| 94 | 38.000 | 26.000 |
| 96 | 38.000 | 26.000 |
| 98 | 40.000 | 26.000 |
| 100 | 36.000 | 20.000 |
| 102 | 38.000 | 20.000 |
| 104 | 36.000 | 22.000 |
| 106 | 32.000 | 22.000 |
| 108 | 26.000 | 22.000 |
| 110 | 26.000 | 16.000 |
| 112 | 26.000 | 14.000 |
| 114 | 24.000 | 16.000 |
| 116 | 24.000 | 14.000 |
| 118 | 24.000 | 16.000 |
| 120 | 24.000 | 12.000 |
| 122 | 24.000 | 8.000 |
| 124 | 22.000 | 10.000 |
| 126 | 20.000 | 12.000 |
| 128 | 18.000 | 14.000 |
| 130 | 18.000 | 8.000 |
| 132 | 18.000 | 8.000 |
| 134 | 18.000 | 8.000 |
| 136 | 18.000 | 10.000 |
| 138 | 16.000 | 8.000 |
| 140 | 16.000 | 6.000 |
| 142 | 18.000 | 6.000 |
| 144 | 16.000 | 6.000 |
| 146 | 16.000 | 8.000 |
| 148 | 16.000 | 8.000 |
| 150 | 14.000 | 4.000 |
| 152 | 14.000 | 4.000 |
| 154 | 16.000 | 6.000 |
| 156 | 14.000 | 6.000 |
| 158 | 16.000 | 6.000 |
| 160 | 14.000 | 2.000 |
| 162 | 14.000 | 2.000 |
| 164 | 12.000 | 4.000 |
| 166 | 12.000 | 4.000 |
| 168 | 14.000 | 4.000 |
| 170 | 12.000 | 0.000 |
| 172 | 12.000 | 2.000 |
| 174 | 12.000 | 0.000 |
| 176 | 12.000 | 0.000 |
| 178 | 10.000 | 2.000 |
| 180 | 12.000 | 0.000 |
| 182 | 12.000 | 0.000 |
| 184 | 12.000 | 0.000 |
| 186 | 8.000 | 0.000 |
| 188 | 10.000 | 0.000 |
| 190 | 12.000 | 0.000 |
| 192 | 12.000 | 0.000 |
| 194 | 8.000 | 0.000 |
| 196 | 8.000 | 0.000 |
| 198 | 8.000 | 0.000 |
At twenty bars and a 0.20 imbalance threshold, one matched sample recorded 442 executions with volume weighting and 242 with equal votes. The price history, threshold, and strength rule were the same. Changing the weights changed more than the appearance of the line. At that same lookback and threshold, the volume-weighted rule also recorded more executions in all eight historical replications.
This separate comparison uses small positions and fixes the threshold and strength rule while varying lookback. Recorded execution counts include position state and the platform’s fill model. They are not counts of every qualifying candle.
A larger imbalance requirement can reduce activity, but that alone does not improve a strategy. Lower activity changes exposure and fee costs as well as which moves the strategy catches. The evidence gives returned performance summaries alongside their observed-row counts.
OBV settings and comparisons
Raw OBV has no rolling period: it accumulates. A period enters when a trader adds smoothing, measures a rolling change, or defines a breakout window. Specify which of those is being changed.
OBV and VWAP also answer different questions. OBV signs volume by the direction of the close. VWAP averages prices using volume weights. Neither is an interchangeable measure of actual order flow.
For a reproducible test, keep the volume feed fixed and define the lookback, normalization, threshold, and position rule. Comparing the two weightings under the same rules makes the effect of volume easier to assess.
Reproduce the comparison
The script defaults to twenty-bar volume-weighted flow and a zero-threshold strength rule. Equal-vote mode is a matched control for closing direction.
//@version=6
strategy("OBV Lab: signed volume and equal votes", overlay=false, initial_capital=10000, default_qty_type=strategy.percent_of_equity, default_qty_value=99, process_orders_on_close=false)

flow_length = input.int(20, "Flow lookback", minval=2, maxval=198)
threshold = input.float(0.0, "Imbalance threshold", minval=0.0, maxval=0.8)
weight_mode = input.int(0, "Weight: 0 volume, 1 equal votes", minval=0, maxval=1)
rule_mode = input.int(0, "Rule: 0 strength, 1 fade", minval=0, maxval=1)

vote = close > close[1] ? 1.0 : close < close[1] ? -1.0 : 0.0
obv_value = ta.obv
volume_total = flow_length * ta.sma(volume, flow_length)
volume_flow = volume_total > 0 ? (obv_value - obv_value[flow_length]) / volume_total : na
equal_flow = ta.sma(vote, flow_length)
flow = weight_mode == 0 ? volume_flow : equal_flow
ready = bar_index >= 500 and volume_total > 0
enter_long = ready and (rule_mode == 0 ? flow > threshold : flow < -threshold)
exit_long = ready and (rule_mode == 0 ? flow < 0 : flow >= 0)

plot(flow, "Normalized signed flow", color=color.blue)
plot(threshold, "Upper threshold", color=color.orange)
plot(-threshold, "Lower threshold", color=color.green)
plot(0, "Balance", color=color.gray)
if exit_long and strategy.position_size > 0
    strategy.close("Long")
if enter_long and not exit_long and strategy.position_size == 0
    strategy.entry("Long", strategy.long)
Markets, settings, accounting, and reproducibility
The study used Binance Spot BTCUSDT and ETHUSDT on two-hour and four-hour candles in 2021-01-01–2023-12-31 and 2024-01-01–2025-12-31. The eight historical frames use the same frozen grid; the later window is retrospective replication.
The two BTCUSDT two-hour main frames and the earlier frame’s activity controls were run through TrainBard’s MCP endpoint. Remaining frames were run through its web interface with the same frozen scripts. Completed UI totals, exact parameter membership, settings snapshots, and original exports are reconciled before inclusion. Omitted zero-trade tuples remain valid tested configurations; execution counts of zero are retained without inventing absent performance cells. Interface bridge checks are outside the main count.
Each frame has 16,236 configurations: 99 even lookbacks from 2 through 198, 41 imbalance thresholds from 0 through 0.8 in steps of 0.02, two weightings, and two rules. The requested grid contains 129,888 configurations. The main count is 129,887 accepted evaluations: one ETHUSDT two-hour earlier-window volume/fade tuple, lookback 2 and threshold 0.28, returned a runtime error in both its original run and an identical single-setting diagnostic. It is excluded, and its exact server cause remains unknown. The original joint UI batch was initially rejected; a documented independent review then accepted only its clean metric rows and uniquely reconciled zero tuples, preserving both the rejection and reviewed acceptance history. No result was substituted for the failed tuple. The accepted data contain 80,080 observed metric rows and 49,807 valid UI-omitted zero tuples. Return and drawdown summaries use the observed rows only; their coverage of cash configurations differs by interface. Fine thresholds can share an identical equal-vote decision path; all are related tested settings, not independent evidence. Diagnostic runs are excluded. 1,584 additional fixed small-notional evaluations repeat the complete activity curves across the same eight frames. In those controls, each entry requests qty = 100 / signal close; actual next-open fill notional can differ. Their smaller requested size separates the displayed activity comparison from the broad sweeps’ equity-funding behavior. The exact activity-control script is retained separately; these confirmations are excluded from the main count. The control total includes 119 reconciled UI-omitted zero tuples, with no invented portfolio metrics.
Volume flow is (OBV − OBV[length]) divided by length × SMA(volume, length). Equal flow is the SMA of +1, −1, or 0 closing-direction votes. Strength entries require flow greater than the threshold and exit below zero. Fade entries require flow less than minus the threshold and exit at or above zero. Entry requires flat position state; exit takes priority.
Every frame starts with 10,000 USDT and 500 startup bars in cash. Signals use completed candles and request next-open execution, 99% equity sizing, no leverage, and 0.1% combined fee/slippage per execution. That sizing request does not guarantee a persistent 1% cash reserve in returned fills. Idle cash earns no yield. Remaining positions are valued at the endpoint. The same 500-bar startup spans different elapsed time on the two candle sizes.
The end-date boundary includes the candle opening at 00:00 UTC on the named final date. Each buy and sell counts as an execution; totalTrades is not a count of completed round trips. Return and drawdown use the platform’s returned metrics. The execution and source audit preserves passive controls, sizing and fee checks.
All direct indicator measurements use exact TrainBard-returned candles. An official-archive crosscheck found small earlier-window differences, including volume fields, preserved in the audit. The teaching chart uses later-window values that matched the archive comparison.
The 20-bar sign comparison has 61,664 post-startup candle observations across eight frames. Strictly opposing nonzero signs and equal-vote ties are reported separately for each frame in the study evidence. Two-hour and four-hour observations are related representations of the same markets and are not independent trials.
The historical chart selects the largest volume/equal-flow difference among strict opposite-sign observations in the BTCUSDT two-hour later frame. It is a conditional teaching example with locally calculated values and no execution markers. The activity chart uses the fixed small-notional controls on the BTCUSDT two-hour early frame, a 0.20 threshold, and the strength rule, varying only lookback and weighting.
The evidence file contains run identifiers, exact grids, per-frame counts, results summaries, candle provenance, checksums, and the calculation selection rule. The tested script accompanies it; full requests and exports remain in the research archive. The tests concern normalized flow rules, not all OBV strategies or divergence detection.
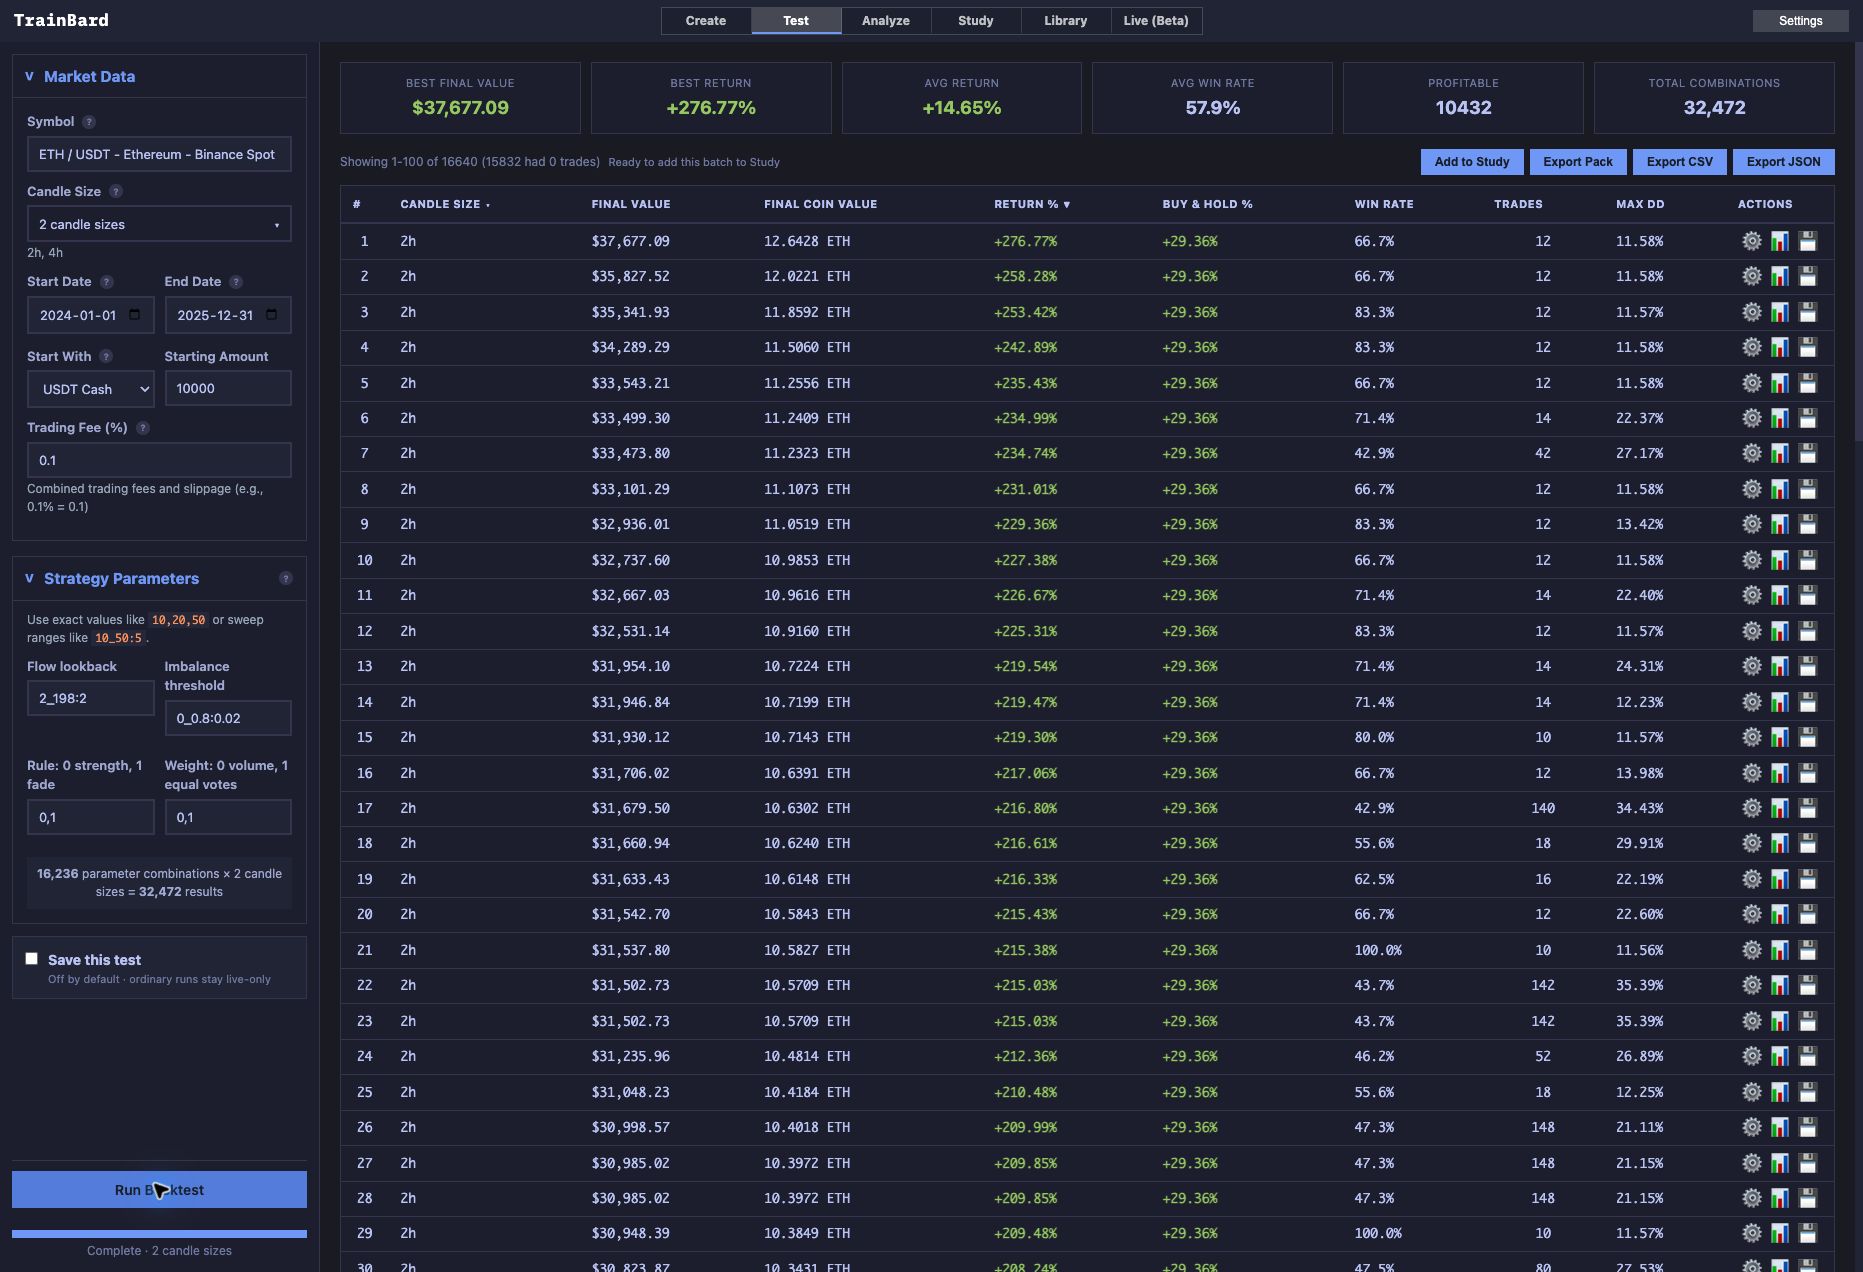
This later ETHUSDT two- and four-hour batch completed 32,472 configurations without error flags. The separate earlier-window failed setting is accounted for above. The best displayed row is completion evidence, not a recommended setting.
See VWAP for another use of volume weights, and RSI for a different way to summarize the direction and size of recent price changes.