Key takeaways
- MACD subtracts a slow exponential moving average from a fast one; its signal smooths MACD, and the histogram is their difference.
- A negative histogram means MACD is below its signal; MACD itself can still be positive.
- A slower signal can enlarge the gap enough to make a rule that requires a minimum gap busier. Historical activity differences do not establish better returns.
What is MACD?
The moving average convergence divergence indicator, usually called MACD, compares a fast moving average with a slower one. It shows their distance as a line that moves above and below zero. A second line smooths that distance; the histogram shows the gap between the two lines.
The familiar settings are 12, 26, 9. They mean bars on your chart: 12 two-hour candles on a two-hour chart, or 12 daily candles on a daily chart. Changing the candle size changes the elapsed time the indicator remembers. These familiar defaults are not a universal optimum.
MACD is an unbounded indicator. Its values are in the same units as the price, so a reading of 100 has a different meaning on a $100 asset and a $50,000 asset. Fidelity’s MACD guide introduces it as a trend-oriented momentum oscillator.
MACD formula and the 12/26/9 settings
The usual calculation uses exponential moving averages, or EMAs, which give more weight to recent observations:
- MACD line = EMA 12 of the closing price − EMA 26 of the closing price
- Signal line = EMA 9 of the MACD line
- Histogram = MACD line − signal line
The signal line averages MACD, not the price. If the fast price EMA is 102 and the slow one is 100, MACD is 2. If its signal is 1.5, the histogram is 0.5. This is the three-part calculation described in TradingView’s indicator reference.
How to read MACD signals
Two crossings often share a name while comparing different things:
| Observation | What the calculation tells you |
|---|---|
| MACD crosses above zero | The fast price EMA has moved above the slow price EMA. |
| MACD crosses above its signal | MACD has moved above its own smoothed value; the histogram becomes positive. |
| A positive histogram shrinks | MACD remains above its signal, but their gap is narrowing. |
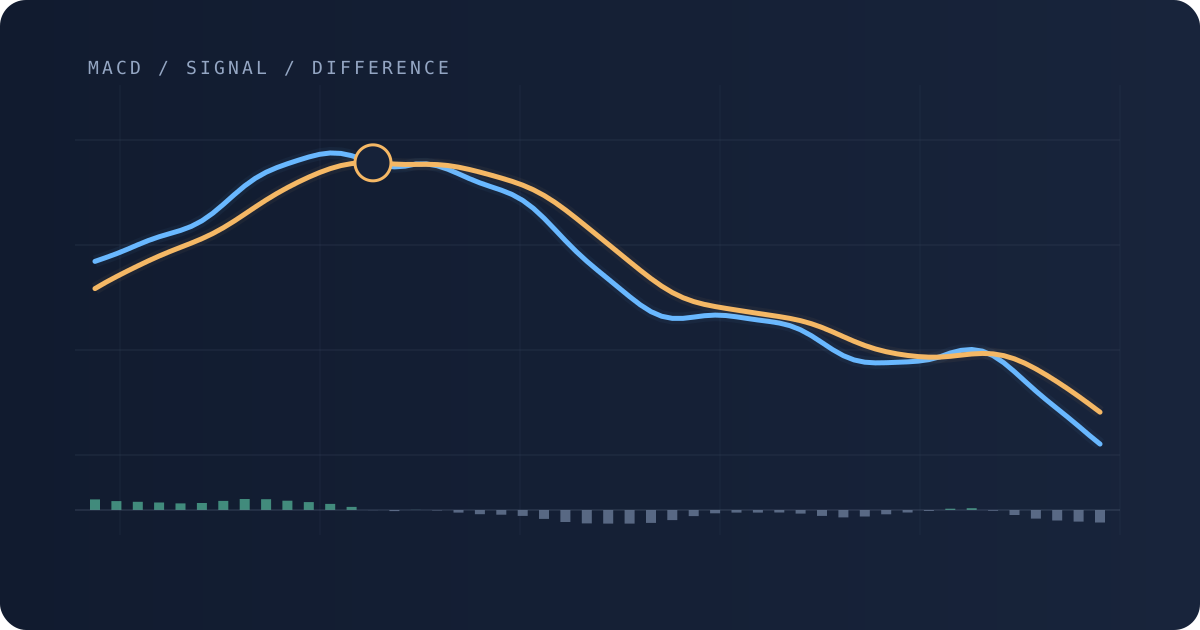
Two different zero crossings: the histogram compares MACD with signal, while MACD compares the fast EMA with the slow EMA.
The value table below is available without JavaScript.
Data and calculation details
Accessible value table (180 observations)
| Observation | Invented price · Price | MACD and its signal · MACD 12/26 | MACD and its signal · Signal 9 | Their difference · Histogram = MACD − signal |
|---|---|---|---|---|
| Bar 61 | 105.315 | 0.523 | 0.655 | -0.132 |
| Bar 62 | 105.619 | 0.520 | 0.628 | -0.108 |
| Bar 63 | 105.914 | 0.535 | 0.609 | -0.075 |
| Bar 64 | 106.143 | 0.559 | 0.599 | -0.040 |
| Bar 65 | 106.301 | 0.584 | 0.596 | -0.012 |
| Bar 66 | 106.430 | 0.607 | 0.598 | 0.009 |
| Bar 67 | 106.945 | 0.659 | 0.611 | 0.049 |
| Bar 68 | 107.542 | 0.741 | 0.637 | 0.104 |
| Bar 69 | 108.218 | 0.850 | 0.679 | 0.170 |
| Bar 70 | 108.919 | 0.981 | 0.740 | 0.242 |
| Bar 71 | 109.558 | 1.124 | 0.817 | 0.308 |
| Bar 72 | 110.061 | 1.264 | 0.906 | 0.358 |
| Bar 73 | 110.397 | 1.385 | 1.002 | 0.383 |
| Bar 74 | 110.601 | 1.481 | 1.098 | 0.383 |
| Bar 75 | 110.753 | 1.551 | 1.188 | 0.363 |
| Bar 76 | 110.941 | 1.604 | 1.271 | 0.332 |
| Bar 77 | 111.225 | 1.649 | 1.347 | 0.302 |
| Bar 78 | 111.611 | 1.697 | 1.417 | 0.280 |
| Bar 79 | 112.052 | 1.750 | 1.483 | 0.266 |
| Bar 80 | 112.481 | 1.806 | 1.548 | 0.258 |
| Bar 81 | 112.854 | 1.859 | 1.610 | 0.249 |
| Bar 82 | 113.169 | 1.904 | 1.669 | 0.235 |
| Bar 83 | 113.478 | 1.943 | 1.724 | 0.219 |
| Bar 84 | 113.860 | 1.981 | 1.775 | 0.206 |
| Bar 85 | 114.377 | 2.030 | 1.826 | 0.204 |
| Bar 86 | 115.043 | 2.098 | 1.880 | 0.218 |
| Bar 87 | 115.814 | 2.189 | 1.942 | 0.247 |
| Bar 88 | 116.601 | 2.299 | 2.013 | 0.285 |
| Bar 89 | 117.313 | 2.415 | 2.094 | 0.321 |
| Bar 90 | 117.893 | 2.524 | 2.180 | 0.345 |
| Bar 91 | 118.345 | 2.618 | 2.267 | 0.350 |
| Bar 92 | 118.721 | 2.691 | 2.352 | 0.339 |
| Bar 93 | 119.096 | 2.748 | 2.431 | 0.316 |
| Bar 94 | 119.520 | 2.794 | 2.504 | 0.291 |
| Bar 95 | 119.997 | 2.837 | 2.571 | 0.267 |
| Bar 96 | 120.482 | 2.877 | 2.632 | 0.245 |
| Bar 97 | 120.904 | 2.910 | 2.688 | 0.222 |
| Bar 98 | 121.212 | 2.926 | 2.735 | 0.191 |
| Bar 99 | 121.400 | 2.921 | 2.772 | 0.149 |
| Bar 100 | 121.523 | 2.893 | 2.797 | 0.097 |
| Bar 101 | 121.670 | 2.850 | 2.807 | 0.043 |
| Bar 102 | 121.929 | 2.805 | 2.807 | -0.002 |
| Bar 103 | 122.345 | 2.771 | 2.800 | -0.029 |
| Bar 104 | 122.905 | 2.757 | 2.791 | -0.034 |
| Bar 105 | 123.542 | 2.765 | 2.786 | -0.021 |
| Bar 106 | 124.174 | 2.791 | 2.787 | 0.004 |
| Bar 107 | 124.345 | 2.793 | 2.788 | 0.005 |
| Bar 108 | 124.447 | 2.771 | 2.785 | -0.014 |
| Bar 109 | 124.523 | 2.728 | 2.773 | -0.046 |
| Bar 110 | 124.637 | 2.672 | 2.753 | -0.081 |
| Bar 111 | 124.836 | 2.614 | 2.725 | -0.111 |
| Bar 112 | 125.121 | 2.561 | 2.692 | -0.131 |
| Bar 113 | 125.436 | 2.516 | 2.657 | -0.141 |
| Bar 114 | 125.694 | 2.473 | 2.620 | -0.148 |
| Bar 115 | 125.818 | 2.420 | 2.580 | -0.160 |
| Bar 116 | 125.776 | 2.348 | 2.534 | -0.186 |
| Bar 117 | 125.598 | 2.251 | 2.477 | -0.226 |
| Bar 118 | 125.360 | 2.130 | 2.408 | -0.278 |
| Bar 119 | 125.152 | 1.994 | 2.325 | -0.331 |
| Bar 120 | 125.035 | 1.856 | 2.231 | -0.375 |
| Bar 121 | 125.015 | 1.725 | 2.130 | -0.405 |
| Bar 122 | 125.049 | 1.605 | 2.025 | -0.420 |
| Bar 123 | 125.069 | 1.495 | 1.919 | -0.424 |
| Bar 124 | 125.030 | 1.388 | 1.813 | -0.425 |
| Bar 125 | 124.931 | 1.281 | 1.706 | -0.426 |
| Bar 126 | 124.823 | 1.174 | 1.600 | -0.426 |
| Bar 127 | 124.786 | 1.073 | 1.494 | -0.421 |
| Bar 128 | 124.884 | 0.990 | 1.394 | -0.404 |
| Bar 129 | 125.135 | 0.934 | 1.302 | -0.368 |
| Bar 130 | 125.498 | 0.908 | 1.223 | -0.315 |
| Bar 131 | 125.884 | 0.908 | 1.160 | -0.252 |
| Bar 132 | 126.203 | 0.923 | 1.113 | -0.189 |
| Bar 133 | 126.395 | 0.940 | 1.078 | -0.138 |
| Bar 134 | 126.462 | 0.948 | 1.052 | -0.104 |
| Bar 135 | 126.454 | 0.943 | 1.030 | -0.088 |
| Bar 136 | 126.444 | 0.927 | 1.010 | -0.083 |
| Bar 137 | 126.482 | 0.907 | 0.989 | -0.082 |
| Bar 138 | 126.573 | 0.888 | 0.969 | -0.081 |
| Bar 139 | 126.671 | 0.871 | 0.949 | -0.078 |
| Bar 140 | 126.707 | 0.851 | 0.930 | -0.079 |
| Bar 141 | 126.624 | 0.819 | 0.908 | -0.089 |
| Bar 142 | 126.417 | 0.768 | 0.880 | -0.112 |
| Bar 143 | 126.136 | 0.697 | 0.843 | -0.146 |
| Bar 144 | 125.873 | 0.612 | 0.797 | -0.185 |
| Bar 145 | 125.715 | 0.526 | 0.743 | -0.217 |
| Bar 146 | 125.711 | 0.452 | 0.685 | -0.232 |
| Bar 147 | 125.851 | 0.401 | 0.628 | -0.227 |
| Bar 148 | 126.070 | 0.373 | 0.577 | -0.204 |
| Bar 149 | 126.289 | 0.365 | 0.534 | -0.170 |
| Bar 150 | 126.450 | 0.367 | 0.501 | -0.134 |
| Bar 151 | 126.545 | 0.372 | 0.475 | -0.103 |
| Bar 152 | 126.616 | 0.377 | 0.456 | -0.078 |
| Bar 153 | 126.728 | 0.386 | 0.442 | -0.056 |
| Bar 154 | 126.929 | 0.405 | 0.434 | -0.030 |
| Bar 155 | 127.220 | 0.438 | 0.435 | 0.003 |
| Bar 156 | 127.547 | 0.485 | 0.445 | 0.040 |
| Bar 157 | 127.564 | 0.517 | 0.459 | 0.058 |
| Bar 158 | 127.449 | 0.528 | 0.473 | 0.055 |
| Bar 159 | 127.169 | 0.508 | 0.480 | 0.028 |
| Bar 160 | 126.749 | 0.453 | 0.475 | -0.022 |
| Bar 161 | 126.263 | 0.366 | 0.453 | -0.087 |
| Bar 162 | 125.802 | 0.257 | 0.414 | -0.157 |
| Bar 163 | 125.425 | 0.138 | 0.359 | -0.220 |
| Bar 164 | 125.142 | 0.021 | 0.291 | -0.270 |
| Bar 165 | 124.909 | -0.089 | 0.215 | -0.304 |
| Bar 166 | 124.661 | -0.195 | 0.133 | -0.328 |
| Bar 167 | 124.352 | -0.300 | 0.047 | -0.346 |
| Bar 168 | 123.979 | -0.408 | -0.044 | -0.364 |
| Bar 169 | 123.594 | -0.519 | -0.139 | -0.380 |
| Bar 170 | 123.277 | -0.626 | -0.237 | -0.389 |
| Bar 171 | 123.095 | -0.716 | -0.333 | -0.384 |
| Bar 172 | 123.071 | -0.781 | -0.422 | -0.359 |
| Bar 173 | 123.163 | -0.816 | -0.501 | -0.315 |
| Bar 174 | 123.287 | -0.824 | -0.566 | -0.258 |
| Bar 175 | 123.351 | -0.816 | -0.616 | -0.200 |
| Bar 176 | 123.294 | -0.804 | -0.653 | -0.151 |
| Bar 177 | 123.115 | -0.801 | -0.683 | -0.118 |
| Bar 178 | 122.862 | -0.809 | -0.708 | -0.101 |
| Bar 179 | 122.605 | -0.826 | -0.732 | -0.095 |
| Bar 180 | 122.398 | -0.847 | -0.755 | -0.093 |
| Bar 181 | 122.243 | -0.866 | -0.777 | -0.089 |
| Bar 182 | 122.096 | -0.883 | -0.798 | -0.085 |
| Bar 183 | 121.886 | -0.903 | -0.819 | -0.084 |
| Bar 184 | 121.554 | -0.935 | -0.842 | -0.092 |
| Bar 185 | 121.093 | -0.986 | -0.871 | -0.115 |
| Bar 186 | 120.552 | -1.058 | -0.908 | -0.149 |
| Bar 187 | 120.019 | -1.145 | -0.956 | -0.189 |
| Bar 188 | 119.586 | -1.234 | -1.011 | -0.223 |
| Bar 189 | 119.303 | -1.313 | -1.072 | -0.241 |
| Bar 190 | 119.163 | -1.371 | -1.131 | -0.239 |
| Bar 191 | 119.104 | -1.405 | -1.186 | -0.219 |
| Bar 192 | 119.049 | -1.420 | -1.233 | -0.187 |
| Bar 193 | 118.940 | -1.425 | -1.271 | -0.153 |
| Bar 194 | 118.766 | -1.426 | -1.302 | -0.124 |
| Bar 195 | 118.571 | -1.426 | -1.327 | -0.099 |
| Bar 196 | 118.418 | -1.422 | -1.346 | -0.076 |
| Bar 197 | 118.359 | -1.408 | -1.358 | -0.049 |
| Bar 198 | 118.395 | -1.377 | -1.362 | -0.015 |
| Bar 199 | 118.473 | -1.332 | -1.356 | 0.024 |
| Bar 200 | 118.507 | -1.278 | -1.340 | 0.062 |
| Bar 201 | 118.415 | -1.229 | -1.318 | 0.089 |
| Bar 202 | 118.686 | -1.155 | -1.285 | 0.131 |
| Bar 203 | 118.815 | -1.073 | -1.243 | 0.170 |
| Bar 204 | 118.873 | -0.992 | -1.193 | 0.201 |
| Bar 205 | 118.949 | -0.912 | -1.137 | 0.225 |
| Bar 206 | 119.104 | -0.826 | -1.074 | 0.249 |
| Bar 207 | 119.349 | -0.729 | -1.005 | 0.276 |
| Bar 208 | 119.641 | -0.622 | -0.929 | 0.306 |
| Bar 209 | 119.917 | -0.509 | -0.845 | 0.336 |
| Bar 210 | 120.128 | -0.398 | -0.755 | 0.357 |
| Bar 211 | 120.273 | -0.295 | -0.663 | 0.368 |
| Bar 212 | 120.401 | -0.200 | -0.571 | 0.370 |
| Bar 213 | 120.594 | -0.109 | -0.478 | 0.370 |
| Bar 214 | 120.922 | -0.010 | -0.385 | 0.375 |
| Bar 215 | 121.410 | 0.107 | -0.286 | 0.393 |
| Bar 216 | 122.020 | 0.246 | -0.180 | 0.426 |
| Bar 217 | 122.670 | 0.404 | -0.063 | 0.467 |
| Bar 218 | 123.267 | 0.571 | 0.064 | 0.507 |
| Bar 219 | 123.750 | 0.733 | 0.198 | 0.536 |
| Bar 220 | 124.113 | 0.881 | 0.334 | 0.547 |
| Bar 221 | 124.404 | 1.011 | 0.470 | 0.541 |
| Bar 222 | 124.692 | 1.123 | 0.600 | 0.523 |
| Bar 223 | 125.028 | 1.225 | 0.725 | 0.500 |
| Bar 224 | 125.418 | 1.323 | 0.845 | 0.478 |
| Bar 225 | 125.816 | 1.415 | 0.959 | 0.457 |
| Bar 226 | 126.151 | 1.499 | 1.067 | 0.432 |
| Bar 227 | 126.363 | 1.564 | 1.166 | 0.398 |
| Bar 228 | 126.440 | 1.603 | 1.254 | 0.350 |
| Bar 229 | 126.429 | 1.615 | 1.326 | 0.289 |
| Bar 230 | 126.419 | 1.605 | 1.382 | 0.223 |
| Bar 231 | 126.502 | 1.585 | 1.423 | 0.163 |
| Bar 232 | 126.730 | 1.570 | 1.452 | 0.118 |
| Bar 233 | 127.100 | 1.570 | 1.476 | 0.094 |
| Bar 234 | 127.555 | 1.588 | 1.498 | 0.090 |
| Bar 235 | 128.015 | 1.621 | 1.523 | 0.098 |
| Bar 236 | 128.424 | 1.661 | 1.550 | 0.111 |
| Bar 237 | 128.771 | 1.701 | 1.580 | 0.120 |
| Bar 238 | 129.097 | 1.739 | 1.612 | 0.127 |
| Bar 239 | 129.469 | 1.778 | 1.645 | 0.133 |
| Bar 240 | 129.937 | 1.827 | 1.682 | 0.145 |
The prices in this first chart are invented to keep the arithmetic visible. Select Positive, but shrinking, then Signal-line crossing. The histogram can turn negative while both lines remain above zero. It is their difference, rather than a third independent measure of price.
Traders also look for divergence. A lower price low alongside a higher MACD low is called bullish divergence; a higher price high alongside a lower MACD high is bearish divergence. Neither guarantees a reversal. Applying that idea requires choosing which highs or lows to compare. Our experiments below use explicit level rules, making their behavior easier to compare across many settings.
Does a smoother MACD signal always mean fewer trades?
A longer signal period draws a slower line. It is natural to expect that to quiet a trading rule. A small decision hurdle changes the question: the gap must now grow large enough before the rule acts.
We tested that intuition in 107,520 related historical evaluations. The rule enters when the histogram is above a positive hurdle and exits when it is below the corresponding negative hurdle. Here, histogram basis points mean 10,000 × (MACD − signal) / current close. A 20-basis-point hurdle describes that gap, not a price return.
Keep the fast/slow EMAs at 12/26 on a two-hour chart. In one tested example, increasing the signal from three bars to five reduced unbuffered executions from 1,391 to 1,125. Add a 20-basis-point hurdle to the same rule, and executions instead rose from 127 to 295. The prices and fast/slow averages are unchanged; only the signal smoothing and hurdle differ. Executions count buys and sells, not completed round trips.
Adding signal smoothing changes activity differently when the histogram must clear a wider hurdle. Activity is not profitability.
The value table below is available without JavaScript.
Data and calculation details
Accessible value table (10 observations)
| Observation | Recorded executions · 0 bps hurdle | Recorded executions · 5 bps hurdle | Recorded executions · 20 bps hurdle |
|---|---|---|---|
| Signal 3 | 1,391.000 | 653.000 | 127.000 |
| Signal 5 | 1,125.000 | 701.000 | 295.000 |
| Signal 7 | 987.000 | 691.000 | 371.000 |
| Signal 9 | 927.000 | 667.000 | 401.000 |
| Signal 11 | 859.000 | 643.000 | 413.000 |
| Signal 13 | 807.000 | 615.000 | 406.000 |
| Signal 15 | 749.000 | 597.000 | 410.000 |
| Signal 17 | 721.000 | 571.000 | 410.000 |
| Signal 19 | 691.000 | 567.000 | 404.000 |
| Signal 21 | 663.000 | 555.000 | 396.000 |
With no extra requirement for MACD itself to be above zero, the wider grid repeated this interaction: signal 3→5 reduced activity in 896/896 observed zero-hurdle pairs and increased it in 873/873 observed 20-basis-point pairs. At five basis points, results were mixed. These comparisons require recorded trades on both sides and share historical prices; they describe the tested rules, not independent statistical trials. Exact datasets and settings are in the methods below.
Why a longer signal can make the gap larger
The same MACD line, two signal lengths, and a 5 basis point histogram hurdle. The selected episode illustrates separation; full-window comparisons establish how often activity changed.
The value table below is available without JavaScript.
Data and calculation details
Accessible value table (75 observations)
| Observation | Closing price · Close | The same MACD, two signal lines · MACD 12/26 | The same MACD, two signal lines · Signal 3 | The same MACD, two signal lines · Signal 9 | Histogram distance, in basis points of price · Histogram 3 | Histogram distance, in basis points of price · Histogram 9 |
|---|---|---|---|---|---|---|
| 2021-05-05T18:00:00Z | 57,136.040 | 88.685 | -42.004 | -297.244 | 22.873 | 67.546 |
| 2021-05-05T20:00:00Z | 56,796.440 | 143.445 | 50.720 | -209.106 | 16.326 | 62.073 |
| 2021-05-05T22:00:00Z | 57,436.110 | 235.741 | 143.231 | -120.137 | 16.107 | 61.961 |
| 2021-05-06T00:00:00Z | 56,835.860 | 257.483 | 200.357 | -44.613 | 10.051 | 53.152 |
| 2021-05-06T02:00:00Z | 56,797.090 | 268.491 | 234.424 | 18.008 | 5.998 | 44.101 |
| 2021-05-06T04:00:00Z | 57,167.030 | 303.566 | 268.995 | 75.120 | 6.047 | 39.961 |
| 2021-05-06T06:00:00Z | 56,814.790 | 299.488 | 284.242 | 119.993 | 2.684 | 31.593 |
| 2021-05-06T08:00:00Z | 57,261.570 | 328.521 | 306.381 | 161.699 | 3.866 | 29.133 |
| 2021-05-06T10:00:00Z | 57,988.000 | 405.472 | 355.927 | 210.453 | 8.544 | 33.631 |
| 2021-05-06T12:00:00Z | 57,271.310 | 403.969 | 379.948 | 249.157 | 4.194 | 27.031 |
| 2021-05-06T14:00:00Z | 57,088.490 | 383.604 | 381.776 | 276.046 | 0.320 | 18.841 |
| 2021-05-06T16:00:00Z | 56,777.000 | 338.429 | 360.102 | 288.523 | -3.817 | 8.790 |
| 2021-05-06T18:00:00Z | 56,128.420 | 247.440 | 303.771 | 280.306 | -10.036 | -5.856 |
| 2021-05-06T20:00:00Z | 56,296.520 | 186.742 | 245.256 | 261.593 | -10.394 | -13.296 |
| 2021-05-06T22:00:00Z | 56,393.680 | 144.809 | 195.033 | 238.236 | -8.906 | -16.567 |
| 2021-05-07T00:00:00Z | 56,197.070 | 94.621 | 144.827 | 209.513 | -8.934 | -20.444 |
| 2021-05-07T02:00:00Z | 55,705.670 | 15.022 | 79.925 | 170.615 | -11.651 | -27.931 |
| 2021-05-07T04:00:00Z | 55,795.360 | -40.358 | 19.783 | 128.421 | -10.779 | -30.250 |
| 2021-05-07T06:00:00Z | 55,766.340 | -85.602 | -32.909 | 85.616 | -9.449 | -30.703 |
| 2021-05-07T08:00:00Z | 56,231.460 | -82.971 | -57.940 | 51.899 | -4.451 | -23.985 |
| 2021-05-07T10:00:00Z | 56,464.740 | -61.355 | -59.647 | 29.248 | -0.302 | -16.046 |
| 2021-05-07T12:00:00Z | 56,997.470 | -1.222 | -30.435 | 23.154 | 5.125 | -4.277 |
| 2021-05-07T14:00:00Z | 57,519.240 | 87.526 | 28.546 | 36.028 | 10.254 | 8.953 |
| 2021-05-07T16:00:00Z | 58,119.990 | 203.984 | 116.265 | 69.619 | 15.093 | 23.118 |
| 2021-05-07T18:00:00Z | 57,584.010 | 250.145 | 183.205 | 105.725 | 11.625 | 25.080 |
| 2021-05-07T20:00:00Z | 57,358.440 | 265.467 | 224.336 | 137.673 | 7.171 | 22.280 |
| 2021-05-07T22:00:00Z | 57,314.750 | 270.960 | 247.648 | 164.330 | 4.067 | 18.604 |
| 2021-05-08T00:00:00Z | 57,558.890 | 291.652 | 269.650 | 189.795 | 3.822 | 17.696 |
| 2021-05-08T02:00:00Z | 58,099.980 | 347.703 | 308.677 | 221.376 | 6.717 | 21.743 |
| 2021-05-08T04:00:00Z | 57,877.970 | 369.946 | 339.311 | 251.090 | 5.293 | 20.536 |
| 2021-05-08T06:00:00Z | 58,463.060 | 429.830 | 384.571 | 286.838 | 7.742 | 24.458 |
| 2021-05-08T08:00:00Z | 58,799.990 | 498.727 | 441.649 | 329.216 | 9.707 | 28.828 |
| 2021-05-08T10:00:00Z | 58,556.090 | 527.567 | 484.608 | 368.886 | 7.336 | 27.099 |
| 2021-05-08T12:00:00Z | 58,828.250 | 565.860 | 525.234 | 408.281 | 6.906 | 26.786 |
| 2021-05-08T14:00:00Z | 57,599.870 | 491.423 | 508.329 | 424.910 | -2.935 | 11.548 |
| 2021-05-08T16:00:00Z | 58,898.980 | 531.136 | 519.733 | 446.155 | 1.936 | 14.428 |
| 2021-05-08T18:00:00Z | 59,030.560 | 566.694 | 543.213 | 470.263 | 3.978 | 16.336 |
| 2021-05-08T20:00:00Z | 58,782.490 | 568.305 | 555.759 | 489.871 | 2.134 | 13.343 |
| 2021-05-08T22:00:00Z | 58,862.050 | 569.438 | 562.599 | 505.785 | 1.162 | 10.814 |
| 2021-05-09T00:00:00Z | 59,126.140 | 584.904 | 573.751 | 521.608 | 1.886 | 10.705 |
| 2021-05-09T02:00:00Z | 58,632.780 | 550.998 | 562.375 | 527.486 | -1.940 | 4.010 |
| 2021-05-09T04:00:00Z | 58,446.510 | 503.296 | 532.835 | 522.648 | -5.054 | -3.311 |
| 2021-05-09T06:00:00Z | 57,965.590 | 421.823 | 477.329 | 502.483 | -9.576 | -13.915 |
| 2021-05-09T08:00:00Z | 57,952.520 | 352.141 | 414.735 | 472.415 | -10.801 | -20.754 |
| 2021-05-09T10:00:00Z | 57,907.490 | 289.942 | 352.338 | 435.920 | -10.775 | -25.209 |
| 2021-05-09T12:00:00Z | 57,220.020 | 183.065 | 267.702 | 385.349 | -14.791 | -35.352 |
| 2021-05-09T14:00:00Z | 57,379.580 | 109.972 | 188.837 | 330.274 | -13.744 | -38.394 |
| 2021-05-09T16:00:00Z | 57,458.730 | 57.766 | 123.301 | 275.772 | -11.406 | -37.941 |
| 2021-05-09T18:00:00Z | 57,266.970 | 0.908 | 62.105 | 220.799 | -10.686 | -38.398 |
| 2021-05-09T20:00:00Z | 58,025.890 | 16.892 | 39.498 | 180.018 | -3.896 | -28.113 |
| 2021-05-09T22:00:00Z | 58,240.840 | 46.370 | 42.934 | 153.288 | 0.590 | -18.358 |
| 2021-05-10T00:00:00Z | 58,700.210 | 105.581 | 74.257 | 143.747 | 5.336 | -6.502 |
| 2021-05-10T02:00:00Z | 59,356.760 | 203.143 | 138.700 | 155.626 | 10.857 | 8.005 |
| 2021-05-10T04:00:00Z | 59,068.050 | 254.234 | 196.467 | 175.348 | 9.780 | 13.355 |
| 2021-05-10T06:00:00Z | 58,370.170 | 235.694 | 216.081 | 187.417 | 3.360 | 8.271 |
| 2021-05-10T08:00:00Z | 57,899.650 | 180.948 | 198.514 | 186.123 | -3.034 | -0.894 |
| 2021-05-10T10:00:00Z | 58,070.630 | 149.634 | 174.074 | 178.825 | -4.209 | -5.027 |
| 2021-05-10T12:00:00Z | 57,675.840 | 91.901 | 132.987 | 161.440 | -7.124 | -12.057 |
| 2021-05-10T14:00:00Z | 58,296.360 | 95.122 | 114.055 | 148.177 | -3.248 | -9.101 |
| 2021-05-10T16:00:00Z | 56,985.300 | -8.025 | 53.015 | 116.936 | -10.712 | -21.929 |
| 2021-05-10T18:00:00Z | 55,733.760 | -188.585 | -67.785 | 55.832 | -21.674 | -43.854 |
| 2021-05-10T20:00:00Z | 55,641.110 | -335.290 | -201.538 | -22.392 | -24.038 | -56.235 |
| 2021-05-10T22:00:00Z | 55,816.140 | -432.447 | -316.992 | -104.403 | -20.685 | -58.772 |
| 2021-05-11T00:00:00Z | 55,565.330 | -523.647 | -420.319 | -188.252 | -18.596 | -60.360 |
| 2021-05-11T02:00:00Z | 55,142.460 | -622.865 | -521.592 | -275.175 | -18.366 | -63.053 |
| 2021-05-11T04:00:00Z | 54,798.000 | -720.980 | -621.286 | -364.336 | -18.193 | -65.084 |
| 2021-05-11T06:00:00Z | 55,740.090 | -714.482 | -667.884 | -434.365 | -8.360 | -50.254 |
| 2021-05-11T08:00:00Z | 55,901.150 | -688.401 | -678.143 | -485.172 | -1.835 | -36.355 |
| 2021-05-11T10:00:00Z | 55,210.470 | -715.219 | -696.681 | -531.182 | -3.358 | -33.334 |
| 2021-05-11T12:00:00Z | 55,750.000 | -685.040 | -690.861 | -561.953 | 1.044 | -22.078 |
| 2021-05-11T14:00:00Z | 56,052.820 | -629.433 | -660.147 | -575.449 | 5.479 | -9.631 |
| 2021-05-11T16:00:00Z | 56,395.100 | -551.388 | -605.767 | -570.637 | 9.643 | 3.413 |
| 2021-05-11T18:00:00Z | 56,608.940 | -466.900 | -536.333 | -549.890 | 12.266 | 14.660 |
| 2021-05-11T20:00:00Z | 56,510.260 | -403.256 | -469.795 | -520.563 | 11.775 | 20.758 |
| 2021-05-11T22:00:00Z | 56,670.020 | -336.053 | -402.924 | -483.661 | 11.800 | 26.047 |
This historical example holds the fast and slow price EMAs at 12 and 26; only the signal length changes. In the lower panel, histogram distance is expressed in basis points of price. One basis point is 0.01%.
Select The longer signal leaves a larger gap. The nine-bar signal trails far enough behind MACD for their difference to exceed the five-basis-point hurdle, while the three-bar difference remains below it. Both use exactly the same MACD line.
A signal line does two jobs in this rule: it smooths MACD, and it sets the reference from which the histogram’s height is measured. That second job helps explain why a slower line can produce more decisions once a hurdle is added.
For a steadily moving MACD line, the signal EMA’s lag grows roughly with its period minus one. An exploratory followup tested that explanation in 10,368 evaluations, scaling the hurdle by that same relationship while leaving signal nine unchanged. A 20-basis-point hurdle at signal nine becomes five at signal three and ten at signal five. At that 20-basis-point baseline, 32 matched cases had all four rule outputs recorded: original signal 3→5 increased activity; the scaled version reduced it in every case. This supports the gap-amplitude explanation, without making the scaling rule a universal fix.
More activity is not a better strategy
In the same 12/26 example with a 20-basis-point hurdle, changing signal 3→5 raised executions from 127 to 295 while recorded return fell from −8.75% to −50.00%. Making the rule busier did not make it better. The useful lesson is the interaction: signal smoothing changes both the smoothness of the reference line and the size of the gap being measured.
That behavior does not identify a universally best signal length. The full methods retain the replication results, passive comparisons and cost sensitivity checks.
For the underlying averages, see our EMA and SMA guides. Our ADX guide separates trend strength from direction, while RSI and Bollinger Bands examine different momentum and volatility measures.
What we tested, and how to reproduce it
The activity chart foregrounds the BTCUSDT two-hour 2021–2023 example with no MACD-above-zero entry gate. Its complete chart-data file also retains the 2024–2025 replication: changing signal 3→5 reduced executions from 941 to 781 without a hurdle and increased them from 39 to 135 at 20 basis points. The worked historical indicator chart uses BTCUSDT two-hour candles from 5–11 May 2021; its generic candle labels count from the start of that excerpt, while the downloadable values retain exact UTC timestamps.
For the selected 12/26, 20-basis-point comparison in 2021–2023, the passive control with the same startup and 99% allocation returned −10.95%, compared with −8.75% at signal three and −50.00% at signal five. Repeating the complete Bitcoin two-hour grid at 0.2% cost per execution, across both historical windows, lowered return in 26,827 of 26,832 observed matched pairs; five moved the other way. Execution counts also changed in 6,257 pairs. These controls show sensitivity to the cost and execution model, rather than simply subtracting a larger fee from identical fills. Neither a selected example nor a winning backtest establishes future outperformance.
The main study uses Binance Spot BTCUSDT and ETHUSDT on two-hour and four-hour candles. The core grids were frozen before exploration. We repeated the same settings in 2021–2023 and 2024–2025; these are historical checks, not prospective live validation.
Accepted coverage is 144,768 related evaluations: 107,520 core settings across eight frames, 10,368 focused scaling evaluations across four Bitcoin frames, and 26,880 doubled-cost evaluations across two Bitcoin two-hour frames. There are 144,609 exported traded rows and 159 reconciled zero-trade settings, with no invalid tuples, row errors or duplicate rows. Deliberate equivalent-rule comparisons are included in this evaluation count; it is not a count of independent ideas or trials.
Each run begins with 10,000 USDT cash, holds a long position or cash, requests orders for the next candle’s open, and waits 500 bars before acting. Position size is 99% of equity, leaving a cash reserve. A separate allocation control showed that using every available dollar could delay entries when the next open rose; we therefore excluded the original 100% runs from the main findings and repeated the fixed grids with the reserve. This correction was made for execution consistency, without choosing allocations for returns. Cash earns no interest. The same number of warmup bars covers more elapsed time on the four-hour chart.
The signal rule enters when histogram exceeds a positive hurdle and exits below its negative counterpart. A hurdle of five basis points means 0.05% of that candle’s price. These are explicit state rules: the first eligible bar can trigger an order without a fresh crossing. An optional entry gate additionally requires MACD above zero. Strict equality triggers neither order.
The core grid uses fast EMAs 6–18 by two, slow EMAs 20–50 by two, signal EMAs 3–21 by two, hurdles of 0/1/2.5/5/10/20 basis points, and both entry-gate choices. The exploratory scaling grid uses fast 8/12/16, slow 20/26/40, signal 2–25, the same six hurdles, and original or scaled mode, on both Bitcoin candle sizes and windows. The scaled hurdle multiplies the original hurdle by (signal length − 1) / 8, leaving the nine-bar signal unchanged. For an approximately linear MACD ramp of slope d per bar, the signal EMA trails it by approximately (signal length − 1) / 2 bars after transients. Histogram distance is therefore approximately d × (signal length − 1) / 2. The followup compensates for this length scale; it does not assume real market curves are steady ramps, or promise identical activity after scaling. The scaling followup was motivated by the original exploration and fixed before the original later-window outputs were opened. The reserve-controlled results repeat that design; they are not a newly untouched holdout. All 1,044 observed identical-rule canary pairs (signal nine or zero hurdle) reproduce complete metrics exactly.
The default combined fee/slippage assumption is 0.1% at each execution. Cost controls repeat the same BTC two-hour settings at 0.2%. Zero-cost sensitivity was unavailable through the current interface: entering zero still produced charged-fee results. Those attempts are preserved as excluded diagnostics, not described as frictionless tests. The date inputs are 2021-01-01–2023-12-31 and 2024-01-01–2025-12-31. The final included candle opens at 00:00 UTC on the end date. The platform’s buy-and-hold benchmark uses the first close and last close across that window; its measurement period includes the 500 bars when the strategy stays in cash. Separate recorded passive controls use the same 99% size, 500-bar startup, next-open order and 0.1% cost, then hold the asset. These controls are excluded from main evaluation totals and supply the startup-matched return comparison.
Original compact exports, screenshots and count ledgers are preserved privately. An auditor checks their hashes, exact Cartesian parameter membership, completed counts, capital, candle size, duplicate tuples, errors and repeated-rule agreement. A missing zero-trade row receives no fabricated metric and enters no matched parameter pair. Passive-baseline coverage separates traded rows from reconciled idle-cash settings: with no orders or interest, idle cash has a known 0% return and therefore beats a negative passive return. Related parameter evaluations and deliberate repeats are not independent statistical trials. The published evidence file records completed counts and source checksums; the methods file includes every completed grid and frame.
The worked historical chart is locally calculated indicator data from checksum-verified official Binance candles, with EMA initialization stated in its source file. It contains no reconstructed fills. Eight recorded executions from the original 100% diagnostic smoke were separately reconciled to official next-candle opens and preceding indicator conditions; that sample verifies the sample, not every execution in the study.
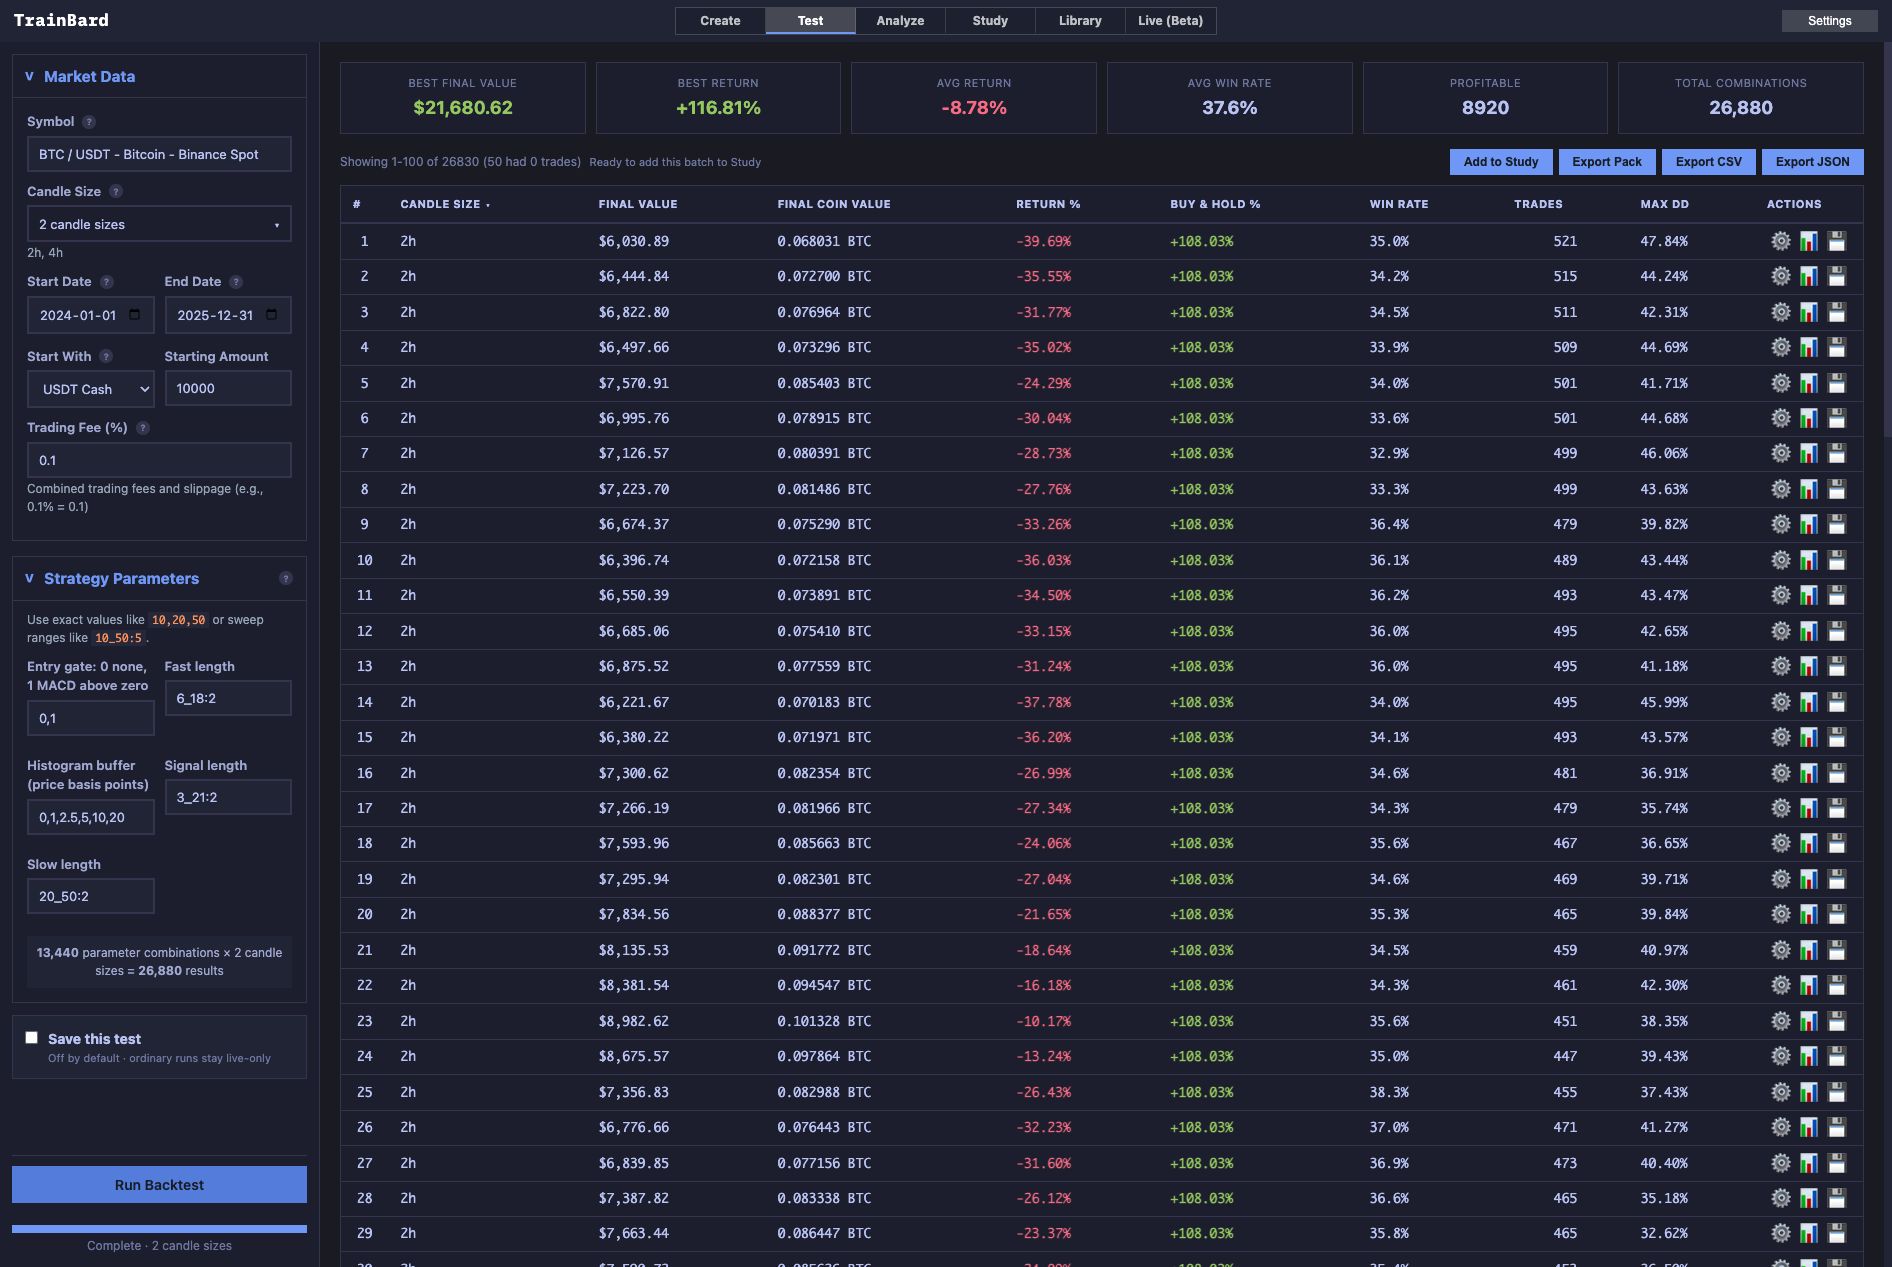
The unaltered completed-batch screenshot shows the later Bitcoin core run: 26,880 evaluations across both candle sizes, 26,830 exported traded rows and 50 zero-trade settings, with dates, costs and grid visible.

Download the main signal script, exploratory scaling script, completed evidence, exact methods, and historical-chart provenance.