Key takeaways
- Ichimoku combines range midpoints and displaced lines. Its conversion and base lines are midpoints of extremes, rather than averages of every close.
- The cloud displayed beside today's price was calculated earlier. The cloud calculated now is also available now, but is normally drawn ahead.
- Changing which cloud age a trading rule compares changes its signals. Neither a forward drawing nor a favorable historical result supplies future information.
The Ichimoku Cloud combines trend direction, range midpoints, and displaced lines in one display. Traders commonly look at price above or below the cloud, the relationship between the conversion and base lines, and the color of the cloud.
Across 84,240 configuration evaluations, we tested a less visible choice: which cloud does the rule actually compare with the price? The cloud drawn beside the current candle and the cloud calculated on that candle contain information from different times. Both can be used without looking into the future, but they define different rules.
What are the five Ichimoku lines?
The familiar settings are 9/26/52, with a forward cloud displacement commonly described as 26 periods. Fidelity’s Ichimoku reference sets out the five lines:
- Tenkan-sen, or conversion line: midpoint of the highest high and lowest low over nine periods.
- Kijun-sen, or base line: the same midpoint calculation over twenty-six periods.
- Senkou Span A: average of the conversion and base lines, drawn ahead.
- Senkou Span B: the midpoint of the fifty-two-period high-low range, also drawn ahead.
- Chikou, or lagging span: the current close drawn backward.
The area between spans A and B forms the cloud, also called the kumo. Its color usually indicates which span is higher. TradingView’s guide explains the plotting shifts and common visual interpretation.
These periods count candles. A nine-period line on a four-hour chart has different elapsed memory from one on a daily chart.
How to calculate the Ichimoku Cloud
For the standard lengths:
Conversion = (highest high over 9 bars + lowest low over 9 bars) / 2
Base       = (highest high over 26 bars + lowest low over 26 bars) / 2
Span A     = (conversion + base) / 2
Span B     = (highest high over 52 bars + lowest low over 52 bars) / 2
These are midpoints of extremes. They do not average all the closing prices as a simple moving average does. If the highest high is 120 and the lowest low is 100, the midpoint is 110, regardless of how many of the other candles closed near 100.
A line can stay flat because neither extreme changed. It can also move when an older extreme leaves the window. A flat base line is therefore information about the range used in its calculation, rather than proof of an unbreakable support level.
Common Ichimoku signals
Price above the cloud is commonly read as a more positive trend condition; price below it as a more negative condition. Price inside the cloud is less decisive. A conversion line above the base line can add a shorter-term positive condition.
The cloud’s color asks another question: is span A above span B? A green cloud is not a standalone instruction to buy, especially if the price, line relationship, and chosen comparison date disagree.
A conversion/base crossover, a cloud breakout, and a lagging-span confirmation each add a different decision. Our tests isolate a cloud-and-line rule. They do not reproduce every Ichimoku entry, exit, or discretionary interpretation.
The cloud has a calculation date and a display date
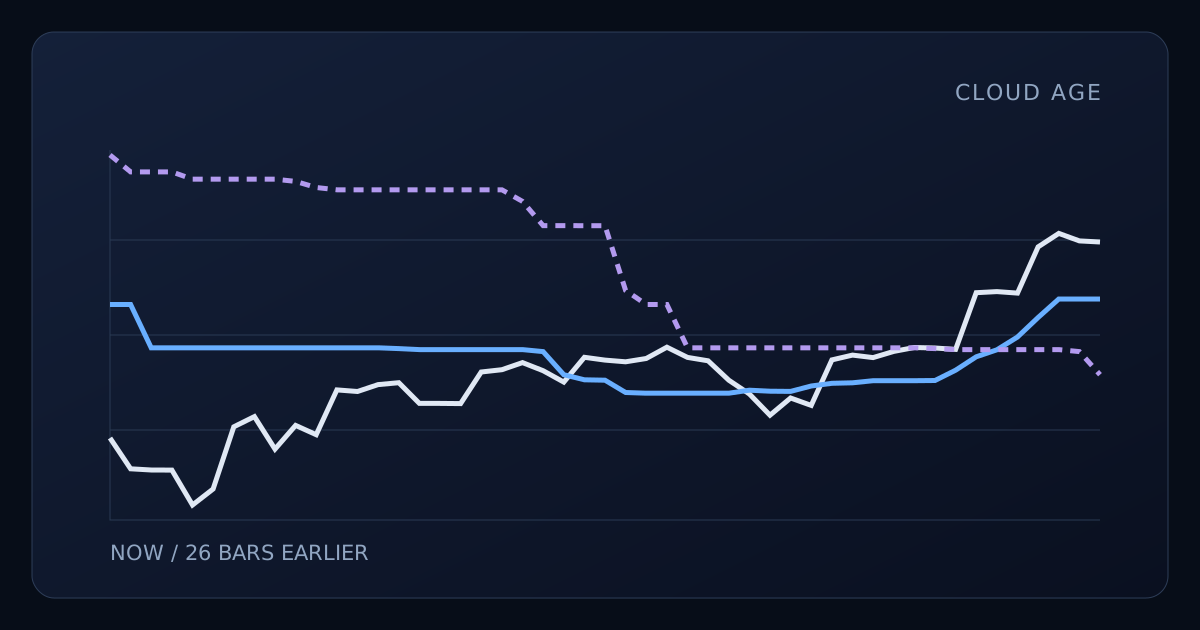
Suppose spans calculated at candle 100 are drawn twenty-six bar intervals to the right. Their display location is candle 126. At candle 126, that displayed cloud contains the values calculated at candle 100.
The spans calculated at candle 126 are already known at its close. Their usual display location is farther to the right. Using them in a rule now is possible, but it is a comparison with the newly calculated cloud, rather than the cloud displayed beside today’s price.
Both boundaries are known on each candle. One uses spans calculated now; the other uses spans calculated 26 bar intervals earlier.
The value table below is available without JavaScript.
Data and calculation details
Accessible value table (49 observations)
| Observation | Close and compared cloud tops · Close | Close and compared cloud tops · Top calculated now | Close and compared cloud tops · Top calculated26bars earlier | Conversion and base · Conversion 9 | Conversion and base · Base 26 |
|---|---|---|---|---|---|
| 2024-08-05T02:00:00Z | 53,890.870 | 58,979.975 | 64,674.005 | 56,698.860 | 57,249.195 |
| 2024-08-05T04:00:00Z | 52,718.000 | 58,979.890 | 64,029.330 | 56,698.775 | 57,249.110 |
| 2024-08-05T06:00:00Z | 52,674.190 | 57,329.890 | 64,029.330 | 54,938.000 | 55,599.110 |
| 2024-08-05T08:00:00Z | 52,667.800 | 57,329.890 | 64,029.330 | 54,291.500 | 55,599.110 |
| 2024-08-05T10:00:00Z | 51,340.000 | 57,329.890 | 63,752.500 | 54,291.500 | 55,599.110 |
| 2024-08-05T12:00:00Z | 51,951.000 | 57,329.890 | 63,752.500 | 54,291.500 | 55,599.110 |
| 2024-08-05T14:00:00Z | 54,321.090 | 57,329.890 | 63,752.500 | 54,066.665 | 55,599.110 |
| 2024-08-05T16:00:00Z | 54,707.990 | 57,329.890 | 63,752.500 | 53,652.795 | 55,586.505 |
| 2024-08-05T18:00:00Z | 53,470.090 | 57,329.890 | 63,752.460 | 52,300.000 | 55,144.000 |
| 2024-08-05T20:00:00Z | 54,372.010 | 57,329.890 | 63,667.500 | 52,300.000 | 55,058.815 |
| 2024-08-05T22:00:00Z | 54,018.810 | 57,329.890 | 63,434.000 | 52,300.000 | 55,058.815 |
| 2024-08-06T00:00:00Z | 55,723.980 | 57,329.890 | 63,349.620 | 52,909.415 | 55,058.815 |
| 2024-08-06T02:00:00Z | 55,665.730 | 57,329.890 | 63,349.620 | 52,909.415 | 55,058.815 |
| 2024-08-06T04:00:00Z | 55,925.970 | 57,329.890 | 63,349.620 | 52,909.415 | 55,058.815 |
| 2024-08-06T06:00:00Z | 55,999.990 | 57,298.070 | 63,349.620 | 54,113.505 | 55,048.775 |
| 2024-08-06T08:00:00Z | 55,211.990 | 57,262.005 | 63,349.620 | 54,415.500 | 55,048.775 |
| 2024-08-06T10:00:00Z | 55,210.010 | 57,262.005 | 63,349.620 | 54,415.500 | 55,048.775 |
| 2024-08-06T12:00:00Z | 55,204.000 | 57,262.005 | 63,349.620 | 54,869.000 | 55,048.775 |
| 2024-08-06T14:00:00Z | 56,405.990 | 57,262.005 | 63,349.620 | 55,241.010 | 55,048.775 |
| 2024-08-06T16:00:00Z | 56,494.000 | 57,262.005 | 63,349.620 | 55,469.415 | 54,938.000 |
| 2024-08-06T18:00:00Z | 56,765.480 | 57,262.005 | 62,904.620 | 55,706.465 | 54,291.500 |
| 2024-08-06T20:00:00Z | 56,458.010 | 57,183.005 | 61,986.005 | 55,706.465 | 54,291.500 |
| 2024-08-06T22:00:00Z | 56,022.010 | 56,305.620 | 61,986.005 | 55,706.465 | 54,291.500 |
| 2024-08-07T00:00:00Z | 56,965.990 | 56,110.000 | 61,979.535 | 55,706.465 | 54,066.665 |
| 2024-08-07T02:00:00Z | 56,862.000 | 56,093.630 | 61,979.535 | 55,829.965 | 53,652.795 |
| 2024-08-07T04:00:00Z | 56,796.010 | 55,625.000 | 59,517.080 | 55,829.965 | 53,143.995 |
| 2024-08-07T06:00:00Z | 56,920.910 | 55,599.110 | 58,979.975 | 56,219.995 | 53,143.995 |
| 2024-08-07T08:00:00Z | 57,350.010 | 55,599.110 | 58,979.890 | 56,613.440 | 53,334.500 |
| 2024-08-07T10:00:00Z | 56,963.380 | 55,599.110 | 57,329.890 | 56,646.965 | 53,639.440 |
| 2024-08-07T12:00:00Z | 56,834.000 | 55,599.110 | 57,329.890 | 56,646.965 | 53,639.440 |
| 2024-08-07T14:00:00Z | 56,094.500 | 55,599.110 | 57,329.890 | 56,646.965 | 53,639.440 |
| 2024-08-07T16:00:00Z | 55,570.590 | 55,714.528 | 57,329.890 | 56,585.525 | 54,843.530 |
| 2024-08-07T18:00:00Z | 54,759.220 | 55,675.863 | 57,329.890 | 56,206.200 | 55,145.525 |
| 2024-08-07T20:00:00Z | 55,416.000 | 55,667.530 | 57,329.890 | 56,189.535 | 55,145.525 |
| 2024-08-07T22:00:00Z | 55,134.160 | 55,873.180 | 57,329.890 | 56,147.335 | 55,599.025 |
| 2024-08-08T00:00:00Z | 56,868.000 | 55,976.798 | 57,329.890 | 56,147.335 | 55,806.260 |
| 2024-08-08T02:00:00Z | 57,049.740 | 55,995.180 | 57,329.890 | 56,147.335 | 55,843.025 |
| 2024-08-08T04:00:00Z | 56,955.620 | 56,075.743 | 57,329.890 | 56,097.490 | 56,053.995 |
| 2024-08-08T06:00:00Z | 57,193.490 | 56,075.743 | 57,329.890 | 56,097.490 | 56,053.995 |
| 2024-08-08T08:00:00Z | 57,339.190 | 56,075.743 | 57,329.890 | 56,097.490 | 56,053.995 |
| 2024-08-08T10:00:00Z | 57,320.510 | 56,084.163 | 57,298.070 | 56,114.330 | 56,053.995 |
| 2024-08-08T12:00:00Z | 57,266.730 | 56,475.650 | 57,262.005 | 56,522.320 | 56,428.980 |
| 2024-08-08T14:00:00Z | 59,428.030 | 56,985.140 | 57,262.005 | 57,031.810 | 56,938.470 |
| 2024-08-08T16:00:00Z | 59,469.880 | 57,253.655 | 57,262.005 | 57,296.500 | 57,210.810 |
| 2024-08-08T18:00:00Z | 59,414.510 | 57,738.773 | 57,262.005 | 58,266.735 | 57,210.810 |
| 2024-08-08T20:00:00Z | 61,173.690 | 58,485.103 | 57,262.005 | 59,013.065 | 57,957.140 |
| 2024-08-08T22:00:00Z | 61,685.990 | 59,187.225 | 57,262.005 | 59,722.570 | 58,651.880 |
| 2024-08-09T00:00:00Z | 61,400.000 | 59,187.225 | 57,183.005 | 59,722.570 | 58,651.880 |
| 2024-08-09T02:00:00Z | 61,358.390 | 59,187.225 | 56,305.620 | 59,722.570 | 58,651.880 |
At the marked candle, the close is 56,862.00. The top calculated on that candle is 56,093.63; the top calculated twenty-six candles earlier is 61,979.54. One above-cloud-top test passes and the other fails. Both calculations use observations already available at that candle close.
The lines use different historical ranges, so the classification can differ even though the current close is identical in both comparisons. A setting called “cloud displacement” needs an exact definition before a chart and a backtest can be compared.
Our script defines the age as an explicit number of bar intervals. At age zero it uses spans calculated on the current candle. At age twenty-six it uses spans calculated twenty-six candles earlier. A platform that counts the current period inclusively may place a similarly named setting one interval differently; the supplied script makes its own convention visible.
What changing cloud age did to activity
The tested rule entered when the close was above both compared spans and the conversion line was above the base. It exited when the close fell below both spans, or the conversion line fell below the base.
We held that rule fixed, then changed the lookbacks and the age of the compared cloud. The familiar 9/26/52 setting remained in the grid.
Conversion 9, base 26, and span B 52 stay fixed. The axis is the age of the compared cloud in actual bar intervals; age 0 uses spans calculated now.
The value table below is available without JavaScript.
Data and calculation details
Accessible value table (27 observations)
| Observation | Executed entries and exits · Cloud age |
|---|---|
| 0 | 590.000 |
| 2 | 578.000 |
| 4 | 560.000 |
| 6 | 552.000 |
| 8 | 536.000 |
| 10 | 528.000 |
| 12 | 510.000 |
| 14 | 498.000 |
| 16 | 494.000 |
| 18 | 476.000 |
| 20 | 466.000 |
| 22 | 464.000 |
| 24 | 472.000 |
| 26 | 462.000 |
| 28 | 476.000 |
| 30 | 478.000 |
| 32 | 468.000 |
| 34 | 462.000 |
| 36 | 470.000 |
| 38 | 464.000 |
| 40 | 456.000 |
| 42 | 460.000 |
| 44 | 446.000 |
| 46 | 436.000 |
| 48 | 432.000 |
| 50 | 420.000 |
| 52 | 414.000 |
In the displayed controlled comparison, changing cloud age from zero to twenty-six changed executions from 590 to 462. The path was not monotonic: ages 24, 26, and 28 gave 472, 462, and 476 executions. An older boundary could make the rule busier again over a nearby interval. Changing age from zero to twenty-six reduced activity in all eight historical samples at these fixed 9/26/52 lookbacks. This describes the tested comparison, rather than all possible cloud ages and settings.
Moving a cloud forward on a chart does not move the available information forward. Increasing its age means the rule compares the current price with boundaries calculated farther in the past. Those boundaries can be higher or lower than newly calculated ones, depending on the path through the lookback windows.
A longer displacement is therefore not simply “more confirmation.” It changes the age of the reference levels. Whether that makes an entry harder, an exit earlier, or a position last longer depends on the rest of the rule and the intervening prices.
Does a forward cloud predict future prices?
No. A forward plot is a placement convention for values calculated from data already observed. It supplies no future candles.
The lagging span creates the opposite visual hazard: today’s close is drawn on an earlier chart location. A historical trading decision at that earlier time could not have used a later close merely because it is now drawn there. A causal rule must identify when the value became available.
The main sweeps produced both higher and lower portfolio returns after changing cloud age from zero to twenty-six while keeping the lookbacks fixed. The same information-timing distinction therefore did not create one universally better historical rule. Sizing and execution assumptions also remain part of those results.
These results describe the chosen historical adaptation. They do not establish that one displacement forecasts better, or that a good cloud-breakout result survives other markets, fees, or risk controls.
Reproduce the cloud-age comparison
This script compares only current or past span values. It uses no future series reference and does not trade the backward-drawn close. The plotted boundaries are the exact boundaries used by the rule, so their meaning is inspectable.
//@version=6
strategy("Ichimoku cloud alignment research", overlay=true, initial_capital=10000, default_qty_type=strategy.percent_of_equity, default_qty_value=99, process_orders_on_close=false)
conversion_length = input.int(9, "Conversion length", minval=2)
base_length = input.int(26, "Base length", minval=2)
span_b_length = input.int(52, "Span B length", minval=2)
cloud_age = input.int(26, "Cloud age in bar intervals", minval=0, maxval=52)
conversion = (ta.highest(high, conversion_length) + ta.lowest(low, conversion_length)) / 2
base = (ta.highest(high, base_length) + ta.lowest(low, base_length)) / 2
span_a = (conversion + base) / 2
span_b = (ta.highest(high, span_b_length) + ta.lowest(low, span_b_length)) / 2
cloud_top = math.max(span_a[cloud_age], span_b[cloud_age])
cloud_bottom = math.min(span_a[cloud_age], span_b[cloud_age])
ready = bar_index >= 500
enter = close > cloud_top and conversion > base
leave = close < cloud_bottom or conversion < base
if ready and strategy.position_size == 0 and enter
    strategy.entry("Long", strategy.long)
if ready and strategy.position_size > 0 and leave
    strategy.close("Long")
plot(conversion, title="Conversion", color=color.aqua)
plot(base, title="Base", color=color.orange)
plot(cloud_top, title="Compared cloud top", color=color.green)
plot(cloud_bottom, title="Compared cloud bottom", color=color.red)
Settings, accounting, and reproducibility
The study contains 84,240 accepted valid main evaluations across Binance Spot BTCUSDT and ETHUSDT, two- and four-hour candles, and the date inputs 2021-01-01–2023-12-31 and 2024-01-01–2025-12-31. Each of the eight datasets uses conversion lengths 3, 5, 7, 9, 11, or 13; base lengths 18–42 in steps of two; span-B lengths 44, 52, 60, 68, or 76; and cloud ages 0–52 in steps of two. All conversion lengths are below base lengths, which are below span-B lengths. There are 10,530 settings per dataset and 3,120 matched age-zero/age-twenty-six pairs across the study.
Every main evaluation started with 10,000 USDT and remained in cash for the first 500 bars. It was long-only with no leverage, no yield on idle cash, and a requested combined fee/slippage of 0.1% per execution. The scripts request 99% equity sizing, evaluate completed-candle conditions and use next-open market orders. This requested percentage does not guarantee a persistent 1% cash reserve across repeated trades. Sizing and costs can change which later signals become recorded executions. Recorded results follow the platform’s fee and fill model; small fixed-quote controls test the activity comparisons separately. A remaining position is valued at the last close.
A selected end date includes the candle opening at 00:00 UTC on that date, rather than the entire final calendar day. Five hundred startup bars cover different elapsed time on two- and four-hour charts. The platform’s first-close to last-close holding return includes that startup and excludes trading costs. Separate recorded passive controls match startup, requested size and entry cost; the shared audit preserves them. Positive strategy return is not the same as beating either holding comparator.
Historical comparisons use the candles returned by TrainBard. An independent check against checksum-verified official monthly archives found exact agreement in the later window and small earlier-window differences, preserved in the shared source audit. Public historical indicator examples use the verified later window. No locally reconstructed trading simulation supplies any performance result.
Accepted evidence combines the completed MCP frames with the remaining frames completed through TrainBard’s web interface. Original web exports, completed count displays, screenshots and exact source checksums remain in the archive. Every missing web-export tuple must reconcile with the completed zero-execution count. Such tuples supply an execution count of zero for activity comparisons; no absent return, drawdown, win-rate or fee value is invented. Return comparisons use pairs for which both portfolio metrics were actually returned.
The main tables contain 84,240 rows with executions and 0 zero-execution configurations. The accepted grid, original exports, completion counts, fees, capital, errors and unique tuples were checked. Two tiny executable diagnostic settings and 216 fixed-quote activity controls are excluded from the main count. The controls hold 9/26/52 fixed, sweep the same cloud-age values across all eight datasets, and use an explicit entry quantity of 100 divided by the signal close. Actual entry value can vary slightly with the next open.
Sixteen additional fixed-quote evaluations compare actual cloud ages 25 and 26, outside the main count. The one-bar change altered execution counts in 6 of the eight fixed-setting historical samples. These check alignment sensitivity without changing the frozen broad grid.
The main family requests percent-of-equity sizing. The activity figure uses the small fixed-quote controls to separate the age comparison from the large-allocation path. The full evidence retains both families, the selected representative panel, and every historical replication. A buy or sell is one execution, and all activity axes begin at zero.
The historical chart uses official checksum-verified BTCUSDT two-hour candles from 2024–2025. It selects an observed close where the above-cloud-top classifications differ at ages zero and twenty-six, maximizing the normalized difference between those tops after startup, then shows twenty-four candles either side. The chart is selected for clarity and does not estimate prevalence or simulate trading. Its source download records the exact dates, formulas and selection. The historical display only illustrates cloud tops; the trading rule uses both top and bottom as specified above.
These are related retrospective evaluations sharing prices and trades, not independent trials or a blind holdout. No Chikou filter is included. Our age is the number of actual historical bar intervals and is not an assertion that every provider’s setting label uses the same indexing convention.
Download the tested script, fixed-quote control script, accepted study evidence, historical-chart provenance, and shared execution and candle audit. Sanitized requests, original responses, complete result tables and hashes remain in the research archive.
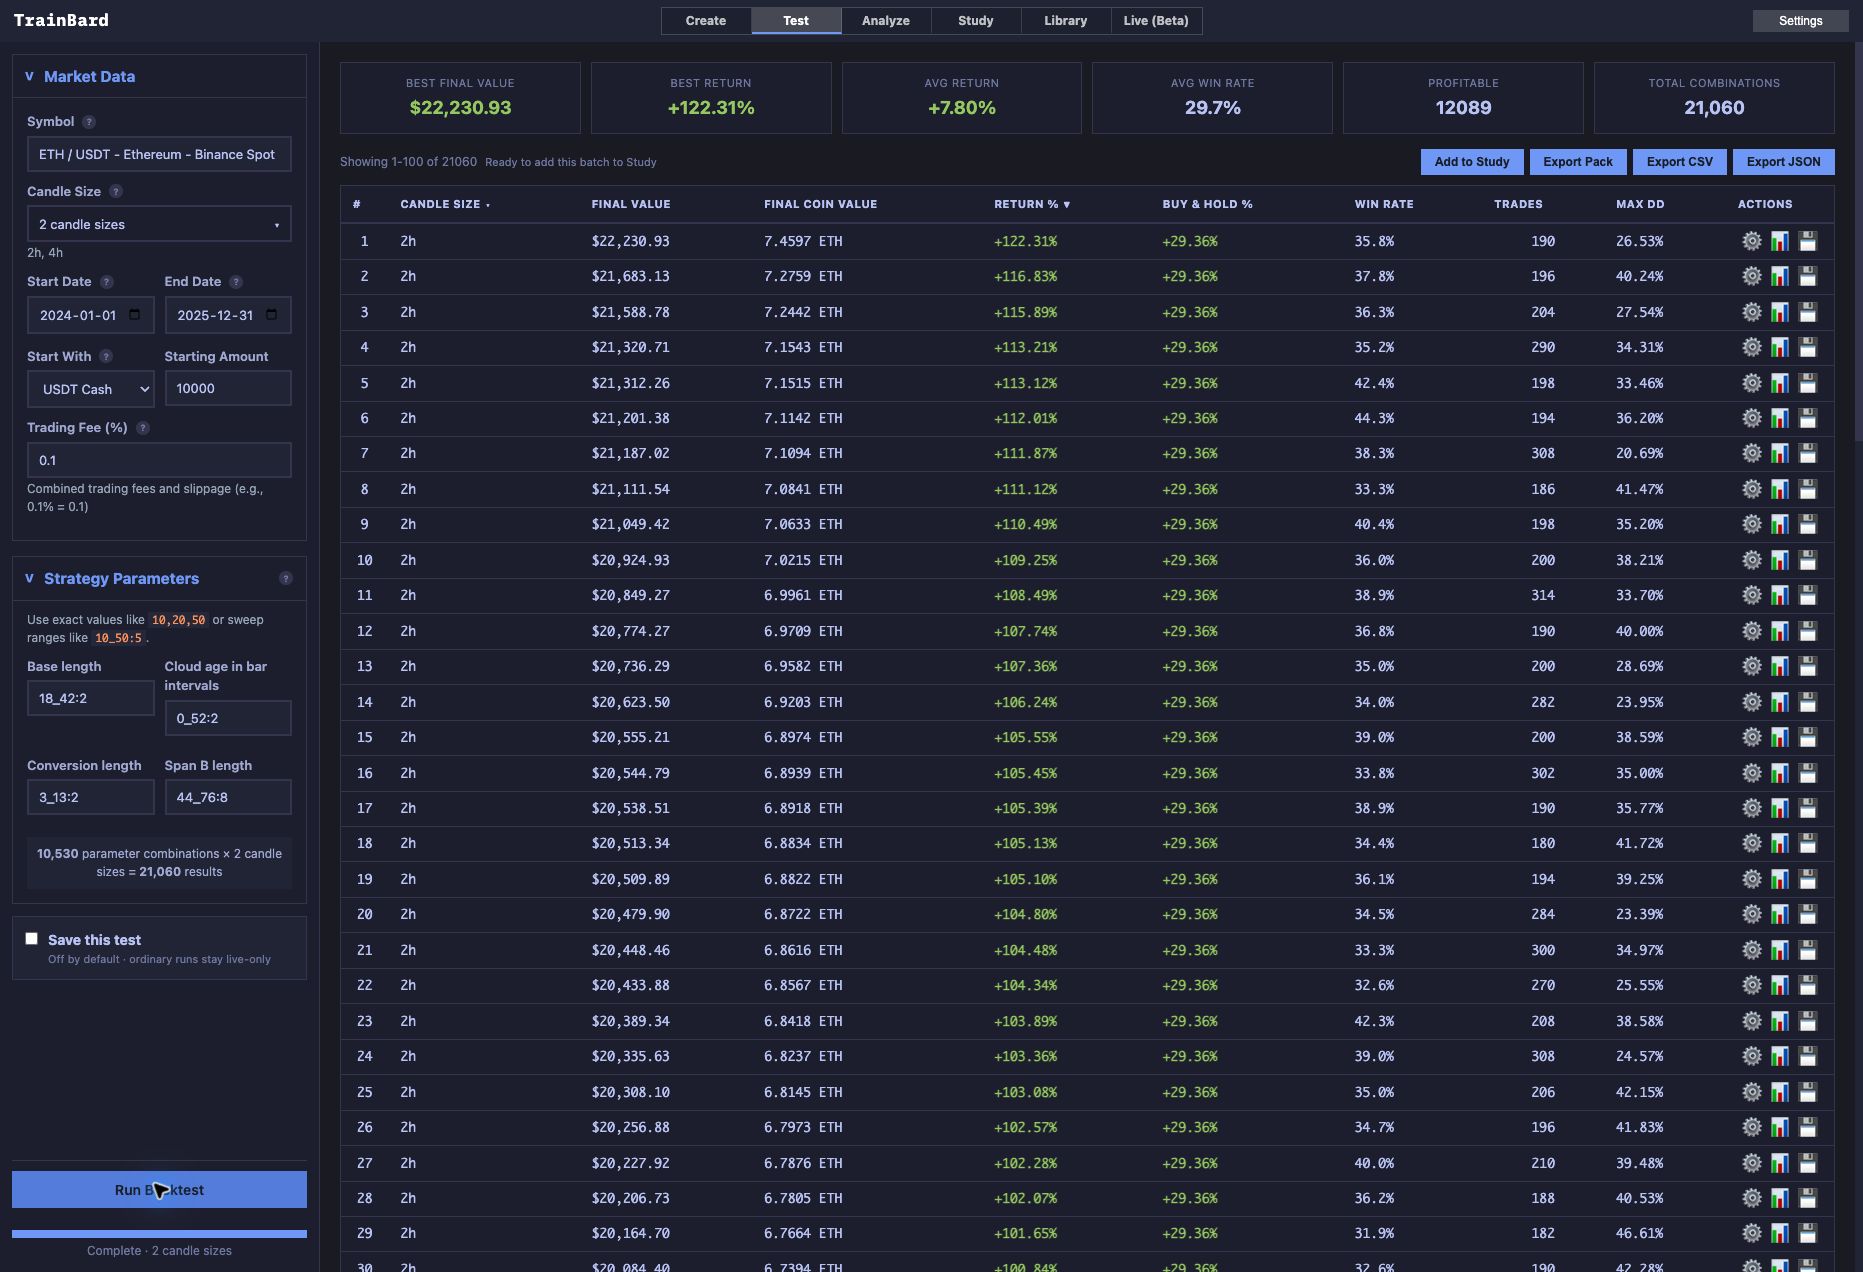
This original UI completion covers 21,060 settings on the later ETHUSDT two- and four-hour frames. It is one component of the full study; the best displayed row is not a recommended setting.
To compare another range-based calculation, see the stochastic oscillator guide. The simple moving average guide explains the different memory created by averaging every close.