Key takeaways
- EMA gives more weight to recent closes but keeps a decaying influence from older prices; its period does not describe a fixed window.
- A faster average does not guarantee a busier trading rule: the distance required before acting can change the comparison with SMA.
- Matched historical tests distinguish responsiveness, transaction activity, and investment results; none is a substitute for the others.
An Exponential Moving Average (EMA) smooths prices while giving more weight to recent observations. It is commonly compared with the Simple Moving Average (SMA), which gives equal weight to every close in its window.
EMA is often described as faster. That is useful shorthand for how it responds to a fresh price change, but it does not tell you how often a complete trading rule will act. We examined 97,216 historical configuration evaluations, then added 6,272 fixed-amount activity controls, to separate the weighting calculation from the decision rule built around it.
How EMA is calculated
The usual EMA update is:
alpha = 2 ÷ (length + 1)
EMA now = alpha × close now + (1 − alpha) × EMA previously
For EMA 20, alpha is 2/21, or about 9.52%. Each new close supplies that fraction of the updated average; the previous EMA supplies the rest. SMA 20 instead gives each of its latest 20 closes a 5% weight. TradingView’s moving-average reference describes these calculations.
Initialization matters near the beginning of a series. Different chart packages can start the recursion differently, so two EMA lines may briefly disagree even when they use the same update formula.
The length follows the chart’s candles. An EMA 20 on an hourly chart and an EMA 20 on a daily chart use the same weighting rule over very different elapsed time.
EMA 20 keeps some history older than 20 candles
SMA 20 drops a close completely when it leaves the window. EMA 20 keeps multiplying that close’s influence by 19/21 as new candles arrive. Its influence becomes small rather than disappearing at a fixed age.
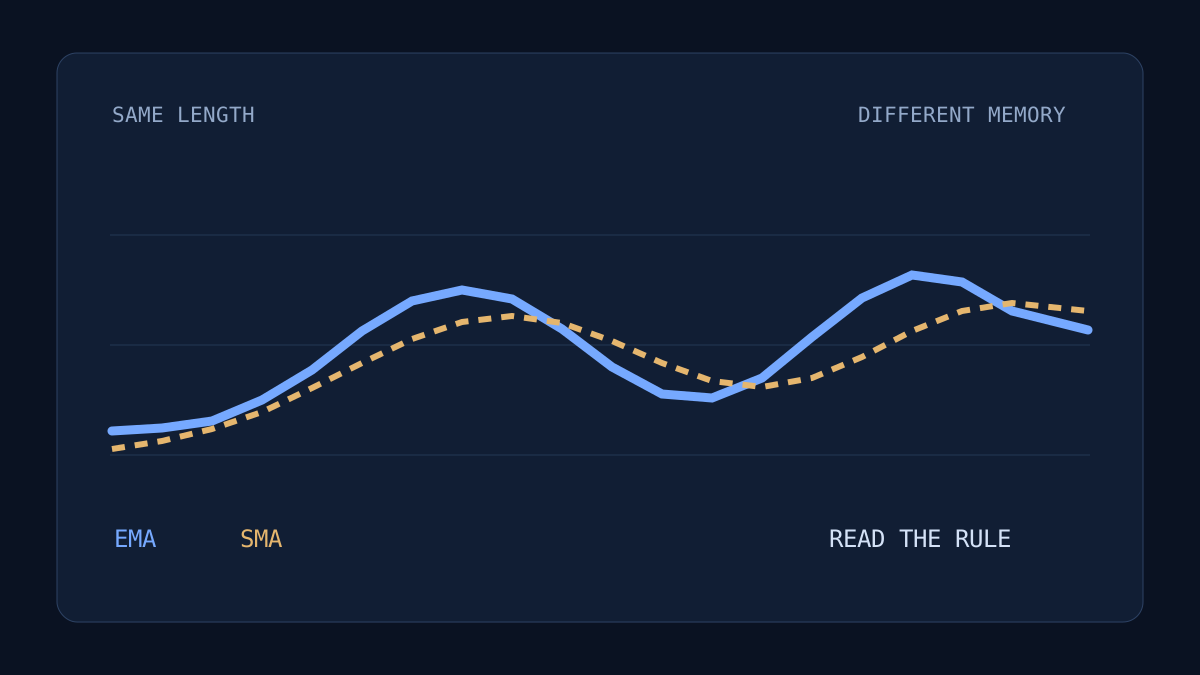
EMA puts almost twice as much weight on the latest close as SMA 20, while keeping a small influence from closes older than 20 candles.
The value table below is available without JavaScript.
Data and calculation details
Accessible value table (60 observations)
| Observation | Weight on each closing price (%) · EMA20 | Weight on each closing price (%) · SMA20 |
|---|---|---|
| 0 | 9.524 | 5.000 |
| 1 | 8.617 | 5.000 |
| 2 | 7.796 | 5.000 |
| 3 | 7.054 | 5.000 |
| 4 | 6.382 | 5.000 |
| 5 | 5.774 | 5.000 |
| 6 | 5.224 | 5.000 |
| 7 | 4.727 | 5.000 |
| 8 | 4.276 | 5.000 |
| 9 | 3.869 | 5.000 |
| 10 | 3.501 | 5.000 |
| 11 | 3.167 | 5.000 |
| 12 | 2.866 | 5.000 |
| 13 | 2.593 | 5.000 |
| 14 | 2.346 | 5.000 |
| 15 | 2.122 | 5.000 |
| 16 | 1.920 | 5.000 |
| 17 | 1.737 | 5.000 |
| 18 | 1.572 | 5.000 |
| 19 | 1.422 | 5.000 |
| 20 | 1.287 | 0.000 |
| 21 | 1.164 | 0.000 |
| 22 | 1.053 | 0.000 |
| 23 | 0.953 | 0.000 |
| 24 | 0.862 | 0.000 |
| 25 | 0.780 | 0.000 |
| 26 | 0.706 | 0.000 |
| 27 | 0.639 | 0.000 |
| 28 | 0.578 | 0.000 |
| 29 | 0.523 | 0.000 |
| 30 | 0.473 | 0.000 |
| 31 | 0.428 | 0.000 |
| 32 | 0.387 | 0.000 |
| 33 | 0.350 | 0.000 |
| 34 | 0.317 | 0.000 |
| 35 | 0.287 | 0.000 |
| 36 | 0.259 | 0.000 |
| 37 | 0.235 | 0.000 |
| 38 | 0.212 | 0.000 |
| 39 | 0.192 | 0.000 |
| 40 | 0.174 | 0.000 |
| 41 | 0.157 | 0.000 |
| 42 | 0.142 | 0.000 |
| 43 | 0.129 | 0.000 |
| 44 | 0.116 | 0.000 |
| 45 | 0.105 | 0.000 |
| 46 | 0.095 | 0.000 |
| 47 | 0.086 | 0.000 |
| 48 | 0.078 | 0.000 |
| 49 | 0.071 | 0.000 |
| 50 | 0.064 | 0.000 |
| 51 | 0.058 | 0.000 |
| 52 | 0.052 | 0.000 |
| 53 | 0.047 | 0.000 |
| 54 | 0.043 | 0.000 |
| 55 | 0.039 | 0.000 |
| 56 | 0.035 | 0.000 |
| 57 | 0.032 | 0.000 |
| 58 | 0.029 | 0.000 |
| 59 | 0.026 | 0.000 |
With the standard formula, roughly 13.51% of EMA 20’s total weight lies on closes at least 20 candles old. Its latest close receives more weight than SMA 20’s latest close, while its older tail remains present.
There is another useful consequence. Both SMA 20 and the established EMA 20 have a weighted average observation age of 9.5 candles. On a perfectly steady linear price rise, both therefore settle at the same distance behind price. They respond differently when the path bends or becomes noisy. “Faster” describes a response pattern; it is not a fixed number of candles saved on every market move.
Common EMA settings and signals
Shorter settings such as 9 or 20/21 emphasize recent movement. Settings such as 50 and 200 describe broader trends. These numbers are conventions, and none defines a universally best trade.
Common uses include:
- Price relative to EMA: price above the average supplies upward trend context; price below supplies downward context.
- EMA slope: a rising or falling line describes how the smoothed price is changing.
- Two-average crossovers: a shorter EMA moving above or below a longer one changes their relative ordering.
- Pullbacks toward EMA: traders watch how price behaves near the line during a trend.
Fidelity’s EMA guide explains these trend and support/resistance interpretations. The line remains a summary of historical prices. A touch or crossing does not establish that a reversal will follow.
Our controlled experiment focuses on price relative to one average. It does not test every crossover or pullback method described above.
The distance before acting changes the result
We compared otherwise identical long-only rules using SMA or EMA at the same length:
No buffer: buy above the average; exit below it.
With buffer: buy above average × (1 + buffer).
             exit below average × (1 − buffer).
A 2% buffer means 2% above the average for entry and 2% below for exit. This is a fixed percentage band, rather than a standard-deviation band. The gap between entry and exit reduces reactions to small movements around the line.
Compare the same length with and without a symmetric 2% decision band. One execution is one buy or sell.
The value table below is available without JavaScript.
Data and calculation details
Accessible value table (196 observations)
| Observation | Recorded executions · small fixed amount · SMA · no buffer | Recorded executions · small fixed amount · EMA · no buffer | Recorded executions · small fixed amount · SMA · 2% buffer | Recorded executions · small fixed amount · EMA · 2% buffer |
|---|---|---|---|---|
| 5 | 3,732.000 | 3,626.000 | 205.000 | 112.000 |
| 6 | 3,376.000 | 3,284.000 | 250.000 | 129.000 |
| 7 | 3,108.000 | 3,042.000 | 265.000 | 147.000 |
| 8 | 2,802.000 | 2,830.000 | 269.000 | 169.000 |
| 9 | 2,597.000 | 2,672.000 | 277.000 | 183.000 |
| 10 | 2,395.000 | 2,502.000 | 287.000 | 189.000 |
| 11 | 2,289.000 | 2,360.000 | 296.000 | 205.000 |
| 12 | 2,151.000 | 2,280.000 | 296.000 | 205.000 |
| 13 | 2,019.000 | 2,172.000 | 302.000 | 203.000 |
| 14 | 1,933.000 | 2,090.000 | 300.000 | 209.000 |
| 15 | 1,837.000 | 2,002.000 | 296.000 | 210.000 |
| 16 | 1,777.000 | 1,934.000 | 292.000 | 212.000 |
| 17 | 1,735.000 | 1,882.000 | 280.000 | 220.000 |
| 18 | 1,719.000 | 1,792.000 | 270.000 | 222.000 |
| 19 | 1,662.000 | 1,732.000 | 266.000 | 222.000 |
| 20 | 1,622.000 | 1,674.000 | 262.000 | 214.000 |
| 21 | 1,614.000 | 1,636.000 | 258.000 | 216.000 |
| 22 | 1,548.000 | 1,600.000 | 248.000 | 212.000 |
| 23 | 1,510.000 | 1,554.000 | 246.000 | 208.000 |
| 24 | 1,466.000 | 1,528.000 | 244.000 | 208.000 |
| 25 | 1,448.000 | 1,474.000 | 242.000 | 208.000 |
| 26 | 1,406.000 | 1,412.000 | 242.000 | 208.000 |
| 27 | 1,376.000 | 1,374.000 | 240.000 | 206.000 |
| 28 | 1,338.000 | 1,366.000 | 240.000 | 202.000 |
| 29 | 1,326.000 | 1,332.000 | 240.000 | 200.000 |
| 30 | 1,292.000 | 1,312.000 | 234.000 | 202.000 |
| 31 | 1,242.000 | 1,276.000 | 230.000 | 198.000 |
| 32 | 1,208.000 | 1,254.000 | 228.000 | 198.000 |
| 33 | 1,150.000 | 1,220.000 | 226.000 | 198.000 |
| 34 | 1,124.000 | 1,178.000 | 224.000 | 196.000 |
| 35 | 1,122.000 | 1,160.000 | 216.000 | 194.000 |
| 36 | 1,102.000 | 1,142.000 | 214.000 | 194.000 |
| 37 | 1,052.000 | 1,128.000 | 216.000 | 194.000 |
| 38 | 1,014.000 | 1,108.000 | 214.000 | 192.000 |
| 39 | 1,006.000 | 1,082.000 | 206.000 | 190.000 |
| 40 | 1,006.000 | 1,066.000 | 202.000 | 186.000 |
| 41 | 1,004.000 | 1,034.000 | 202.000 | 186.000 |
| 42 | 1,006.000 | 1,028.000 | 202.000 | 186.000 |
| 43 | 1,004.000 | 1,030.000 | 194.000 | 182.000 |
| 44 | 976.000 | 1,002.000 | 194.000 | 182.000 |
| 45 | 996.000 | 986.000 | 192.000 | 182.000 |
| 46 | 982.000 | 994.000 | 186.000 | 178.000 |
| 47 | 974.000 | 982.000 | 184.000 | 178.000 |
| 48 | 964.000 | 964.000 | 184.000 | 178.000 |
| 49 | 940.000 | 968.000 | 180.000 | 174.000 |
| 50 | 934.000 | 976.000 | 176.000 | 174.000 |
| 51 | 908.000 | 960.000 | 174.000 | 172.000 |
| 52 | 894.000 | 932.000 | 174.000 | 174.000 |
| 53 | 888.000 | 916.000 | 176.000 | 172.000 |
| 54 | 880.000 | 910.000 | 176.000 | 172.000 |
| 55 | 866.000 | 904.000 | 180.000 | 172.000 |
| 56 | 856.000 | 892.000 | 178.000 | 170.000 |
| 57 | 842.000 | 884.000 | 180.000 | 170.000 |
| 58 | 844.000 | 870.000 | 176.000 | 168.000 |
| 59 | 828.000 | 862.000 | 174.000 | 168.000 |
| 60 | 810.000 | 850.000 | 168.000 | 170.000 |
| 61 | 808.000 | 834.000 | 164.000 | 170.000 |
| 62 | 814.000 | 830.000 | 164.000 | 168.000 |
| 63 | 818.000 | 836.000 | 162.000 | 166.000 |
| 64 | 810.000 | 820.000 | 162.000 | 166.000 |
| 65 | 806.000 | 820.000 | 160.000 | 166.000 |
| 66 | 804.000 | 816.000 | 158.000 | 164.000 |
| 67 | 808.000 | 806.000 | 158.000 | 162.000 |
| 68 | 804.000 | 814.000 | 158.000 | 162.000 |
| 69 | 808.000 | 802.000 | 154.000 | 158.000 |
| 70 | 802.000 | 784.000 | 154.000 | 158.000 |
| 71 | 798.000 | 780.000 | 152.000 | 158.000 |
| 72 | 804.000 | 784.000 | 150.000 | 160.000 |
| 73 | 792.000 | 778.000 | 150.000 | 160.000 |
| 74 | 778.000 | 772.000 | 152.000 | 158.000 |
| 75 | 766.000 | 760.000 | 152.000 | 156.000 |
| 76 | 750.000 | 750.000 | 154.000 | 150.000 |
| 77 | 744.000 | 754.000 | 152.000 | 150.000 |
| 78 | 742.000 | 744.000 | 152.000 | 150.000 |
| 79 | 732.000 | 746.000 | 152.000 | 146.000 |
| 80 | 728.000 | 738.000 | 148.000 | 146.000 |
| 81 | 730.000 | 726.000 | 148.000 | 146.000 |
| 82 | 726.000 | 712.000 | 146.000 | 144.000 |
| 83 | 698.000 | 704.000 | 146.000 | 142.000 |
| 84 | 686.000 | 696.000 | 146.000 | 142.000 |
| 85 | 692.000 | 696.000 | 146.000 | 142.000 |
| 86 | 674.000 | 698.000 | 150.000 | 146.000 |
| 87 | 678.000 | 694.000 | 146.000 | 146.000 |
| 88 | 676.000 | 692.000 | 146.000 | 142.000 |
| 89 | 682.000 | 680.000 | 148.000 | 142.000 |
| 90 | 680.000 | 672.000 | 146.000 | 142.000 |
| 91 | 676.000 | 666.000 | 146.000 | 142.000 |
| 92 | 668.000 | 670.000 | 142.000 | 142.000 |
| 93 | 660.000 | 672.000 | 142.000 | 140.000 |
| 94 | 678.000 | 674.000 | 140.000 | 140.000 |
| 95 | 660.000 | 672.000 | 142.000 | 138.000 |
| 96 | 648.000 | 654.000 | 142.000 | 142.000 |
| 97 | 652.000 | 646.000 | 142.000 | 142.000 |
| 98 | 652.000 | 640.000 | 142.000 | 140.000 |
| 99 | 640.000 | 632.000 | 142.000 | 138.000 |
| 100 | 636.000 | 624.000 | 142.000 | 136.000 |
| 101 | 620.000 | 628.000 | 140.000 | 136.000 |
| 102 | 626.000 | 630.000 | 138.000 | 134.000 |
| 103 | 618.000 | 640.000 | 140.000 | 134.000 |
| 104 | 596.000 | 640.000 | 140.000 | 134.000 |
| 105 | 604.000 | 648.000 | 140.000 | 132.000 |
| 106 | 602.000 | 636.000 | 138.000 | 132.000 |
| 107 | 590.000 | 636.000 | 136.000 | 128.000 |
| 108 | 590.000 | 628.000 | 136.000 | 128.000 |
| 109 | 586.000 | 626.000 | 136.000 | 124.000 |
| 110 | 584.000 | 610.000 | 136.000 | 124.000 |
| 111 | 594.000 | 614.000 | 136.000 | 124.000 |
| 112 | 588.000 | 608.000 | 134.000 | 124.000 |
| 113 | 578.000 | 604.000 | 134.000 | 124.000 |
| 114 | 580.000 | 604.000 | 134.000 | 124.000 |
| 115 | 572.000 | 600.000 | 132.000 | 124.000 |
| 116 | 580.000 | 604.000 | 130.000 | 120.000 |
| 117 | 570.000 | 600.000 | 130.000 | 118.000 |
| 118 | 568.000 | 608.000 | 130.000 | 118.000 |
| 119 | 560.000 | 612.000 | 128.000 | 116.000 |
| 120 | 572.000 | 618.000 | 126.000 | 116.000 |
| 121 | 582.000 | 614.000 | 122.000 | 116.000 |
| 122 | 570.000 | 602.000 | 122.000 | 116.000 |
| 123 | 570.000 | 594.000 | 120.000 | 116.000 |
| 124 | 564.000 | 584.000 | 120.000 | 116.000 |
| 125 | 566.000 | 586.000 | 118.000 | 116.000 |
| 126 | 558.000 | 580.000 | 118.000 | 116.000 |
| 127 | 562.000 | 578.000 | 116.000 | 116.000 |
| 128 | 564.000 | 572.000 | 112.000 | 116.000 |
| 129 | 570.000 | 578.000 | 112.000 | 114.000 |
| 130 | 570.000 | 568.000 | 112.000 | 114.000 |
| 131 | 576.000 | 564.000 | 112.000 | 114.000 |
| 132 | 560.000 | 566.000 | 114.000 | 110.000 |
| 133 | 574.000 | 568.000 | 114.000 | 110.000 |
| 134 | 574.000 | 574.000 | 114.000 | 110.000 |
| 135 | 566.000 | 588.000 | 114.000 | 110.000 |
| 136 | 568.000 | 590.000 | 114.000 | 110.000 |
| 137 | 558.000 | 580.000 | 114.000 | 110.000 |
| 138 | 550.000 | 582.000 | 110.000 | 110.000 |
| 139 | 530.000 | 584.000 | 110.000 | 108.000 |
| 140 | 532.000 | 586.000 | 110.000 | 108.000 |
| 141 | 526.000 | 586.000 | 110.000 | 106.000 |
| 142 | 522.000 | 592.000 | 108.000 | 104.000 |
| 143 | 514.000 | 592.000 | 112.000 | 104.000 |
| 144 | 508.000 | 580.000 | 114.000 | 104.000 |
| 145 | 492.000 | 568.000 | 114.000 | 104.000 |
| 146 | 494.000 | 558.000 | 114.000 | 102.000 |
| 147 | 488.000 | 556.000 | 112.000 | 100.000 |
| 148 | 492.000 | 550.000 | 112.000 | 96.000 |
| 149 | 510.000 | 544.000 | 110.000 | 96.000 |
| 150 | 498.000 | 542.000 | 110.000 | 100.000 |
| 151 | 496.000 | 532.000 | 110.000 | 100.000 |
| 152 | 482.000 | 524.000 | 110.000 | 102.000 |
| 153 | 474.000 | 528.000 | 110.000 | 100.000 |
| 154 | 472.000 | 532.000 | 108.000 | 100.000 |
| 155 | 460.000 | 524.000 | 108.000 | 100.000 |
| 156 | 458.000 | 516.000 | 104.000 | 100.000 |
| 157 | 462.000 | 510.000 | 102.000 | 100.000 |
| 158 | 456.000 | 512.000 | 102.000 | 100.000 |
| 159 | 446.000 | 496.000 | 102.000 | 100.000 |
| 160 | 436.000 | 492.000 | 102.000 | 100.000 |
| 161 | 428.000 | 494.000 | 104.000 | 100.000 |
| 162 | 434.000 | 486.000 | 104.000 | 96.000 |
| 163 | 438.000 | 486.000 | 102.000 | 94.000 |
| 164 | 426.000 | 490.000 | 102.000 | 94.000 |
| 165 | 422.000 | 480.000 | 100.000 | 94.000 |
| 166 | 422.000 | 468.000 | 100.000 | 94.000 |
| 167 | 420.000 | 476.000 | 98.000 | 94.000 |
| 168 | 430.000 | 484.000 | 98.000 | 94.000 |
| 169 | 430.000 | 486.000 | 98.000 | 96.000 |
| 170 | 422.000 | 484.000 | 98.000 | 96.000 |
| 171 | 420.000 | 484.000 | 98.000 | 96.000 |
| 172 | 428.000 | 492.000 | 100.000 | 96.000 |
| 173 | 438.000 | 486.000 | 100.000 | 94.000 |
| 174 | 432.000 | 486.000 | 98.000 | 94.000 |
| 175 | 432.000 | 482.000 | 98.000 | 90.000 |
| 176 | 434.000 | 474.000 | 98.000 | 90.000 |
| 177 | 436.000 | 462.000 | 98.000 | 90.000 |
| 178 | 432.000 | 454.000 | 98.000 | 90.000 |
| 179 | 428.000 | 450.000 | 96.000 | 90.000 |
| 180 | 428.000 | 446.000 | 94.000 | 90.000 |
| 181 | 422.000 | 444.000 | 94.000 | 90.000 |
| 182 | 420.000 | 438.000 | 94.000 | 90.000 |
| 183 | 420.000 | 438.000 | 92.000 | 90.000 |
| 184 | 414.000 | 434.000 | 92.000 | 90.000 |
| 185 | 420.000 | 432.000 | 92.000 | 90.000 |
| 186 | 422.000 | 418.000 | 90.000 | 90.000 |
| 187 | 412.000 | 416.000 | 90.000 | 90.000 |
| 188 | 406.000 | 408.000 | 90.000 | 90.000 |
| 189 | 408.000 | 414.000 | 90.000 | 90.000 |
| 190 | 408.000 | 412.000 | 90.000 | 90.000 |
| 191 | 396.000 | 410.000 | 92.000 | 90.000 |
| 192 | 394.000 | 408.000 | 92.000 | 88.000 |
| 193 | 390.000 | 406.000 | 94.000 | 88.000 |
| 194 | 382.000 | 398.000 | 94.000 | 88.000 |
| 195 | 380.000 | 398.000 | 94.000 | 88.000 |
| 196 | 368.000 | 396.000 | 94.000 | 88.000 |
| 197 | 370.000 | 402.000 | 96.000 | 88.000 |
| 198 | 368.000 | 396.000 | 92.000 | 88.000 |
| 199 | 366.000 | 400.000 | 92.000 | 88.000 |
| 200 | 372.000 | 400.000 | 92.000 | 88.000 |
Each point holds the rule and band fixed and changes only the average length. One execution means one buy or one sell. The displayed activity control uses a small fixed amount to reduce the funding effects that can interrupt orders under near-full allocation.
In the displayed comparison, EMA recorded more executions than SMA at 166 of 196 lengths with no buffer. At a 2% buffer, EMA recorded fewer executions at 163 lengths. This was a change across a broad set of neighboring lengths, rather than a single selected setting.
Across all eight historical comparisons, EMA was busier for a majority of lengths with no buffer. With the 2% buffer, it was quieter for a majority in six of eight. The other two retained a busier EMA majority. The decision band changed the comparison frequently, without making the outcome uniform.
The mechanism is worth keeping in view. An EMA can follow a move more closely, leaving price short of the percentage entry hurdle even when it is far enough from the SMA to qualify. Reacting more strongly to recent prices does not guarantee more completed entry-and-exit cycles. The result depends on the price path, period, and decision distance together.
Fewer transactions do not establish a better investment
A wider band can skip a false crossing, enter a trend later, or miss part of it entirely. Changing the smoother can improve a historical return in one setting and worsen it in another.
The broad study therefore retains return, fees, and platform-reported drawdown alongside activity. It is not a contest decided by the quietest line or the highest single return. The fixed-amount controls isolate activity under a different allocation; their low-exposure returns are not comparable with the main strategy’s returns.
For practical research, write the whole rule before comparing averages: price source, length, entry distance, exit distance, order timing, and allocation. Then compare those same rules across different historical conditions. The label “EMA” supplies only one part of that specification.
Try the tested rule
The defaults use EMA 50 with a 0.5% symmetric buffer. Set smoothing to 0 for the matched SMA rule. The script requests 99% equity sizing and a 500-candle startup; set fees and market dates separately in the backtest settings.
//@version=6
strategy("EMA sensitivity laboratory", overlay=true, initial_capital=10000, default_qty_type=strategy.percent_of_equity, default_qty_value=99, process_orders_on_close=false)
length = input.int(50, "Length", minval=2)
buffer = input.float(0.5, "Symmetric buffer percent", minval=0)
smoothing = input.int(1, "Smoothing: 0 SMA, 1 EMA", minval=0, maxval=1)
s = ta.sma(close, length)
e = ta.ema(close, length)
maValue = smoothing == 0 ? s : e
upper = maValue * (1 + buffer / 100)
lower = maValue * (1 - buffer / 100)
if bar_index >= 500
    if strategy.position_size > 0 and close < lower
        strategy.close("Long")
    else if strategy.position_size == 0 and close > upper
        strategy.entry("Long", strategy.long)
plot(maValue, title="Average", color=color.blue)
plot(upper, title="Entry band", color=color.green)
plot(lower, title="Exit band", color=color.orange)
Study design, complete comparisons, and execution limits
The main grid contains lengths 5–200 by 1, symmetric buffers 0–3% by 0.1 percentage point, and two smoothers. That is 12,152 settings per frame × eight frames = 97,216 configuration evaluations. These are related settings, not independent statistical trials.
The frames are Binance Spot BTCUSDT and ETHUSDT, 2h and 4h candles, and windows 2021-01-01–2023-12-31 and 2024-01-01–2025-12-31, with UTC date endpoints. Date-only endpoints are candle-open boundaries: the final supplied candle opens at 00:00 UTC on the listed end date, rather than covering that entire calendar day. The earlier window guided exploration; the unchanged script and grid were carried across the other frames. All are retrospective comparisons. Earlier projects had already exposed these historical periods, so the later window is not a blind holdout.
Every main run starts with 10,000 USDT cash, requests 99% equity allocation, has no leverage or cash yield, and uses 0.1% combined fee/slippage per execution. A persistent 1% cash reserve is not guaranteed by the recorded fill model. Flat-position guards prevent repeated entry requests while a position is held. A close beyond the relevant band requests a market order for the following candle; gaps, fees, and available cash can affect fills.
The first 500 candles are a common startup inside each selected window. EMA 200 still retains about 0.67% of its initial-state influence after 500 updates; startup reduces initialization effects without proving exact convergence. Identical candle counts represent different elapsed time on the two candle sizes.
The additional 6,272 activity evaluations repeat all 196 lengths at buffers 0 and 2% for both smoothers across all eight frames, using quantity 100 / close at the signal candle. This requests an amount near 100 USDT; the following open can change its realized value. A separate 32-row set checks length 50 at buffers 0 and 0.5% under the same small-amount sizing. These controls and the detailed default trace are excluded from the 97,216 main count. The displayed activity panel is the earlier BTCUSDT 2h fixed-amount control; the downloadable chart retains three representative panels, and the complete eight-frame profiles remain in the evidence file.
Main results were collected through TrainBard’s MCP and web interface. Every original export was preserved and checked against its exact requested parameter grid. Browser exports were also reconciled with visible completion, zero-trade, error, cost and date settings. A separate four-row interface comparison matched every common numeric metric exactly and is excluded from the main count. No failed or duplicate tuples were accepted. Recorded execution counts can still reflect the platform’s funding model; fixed-amount controls reduce that confound without turning the observations into a universal signal-count theorem. Batch metrics have slightly lower numerical precision than detailed runs.
The compact study evidence preserves all frame definitions, run identifiers, result checksums, paired comparisons, selected rows, and complete activity profiles. The shared execution and source audit records same-start passive benchmarks, fill/fee controls, and candle checks. Returned historical series can differ slightly from exchange monthly archives, so the exact run candles take precedence for execution comparisons. Buy-and-hold in a platform summary starts before the strategy’s startup; the separately recorded startup-matched passive controls are the relevant aligned comparison.
The weight chart is a mathematical illustration using alpha = 2/21. Its finite display omits ages 60 and older; the remaining EMA weight is about 0.247%. The equal-average-age statement follows from the geometric weight formula and describes an established linear trend, rather than an assertion about every observed reversal.
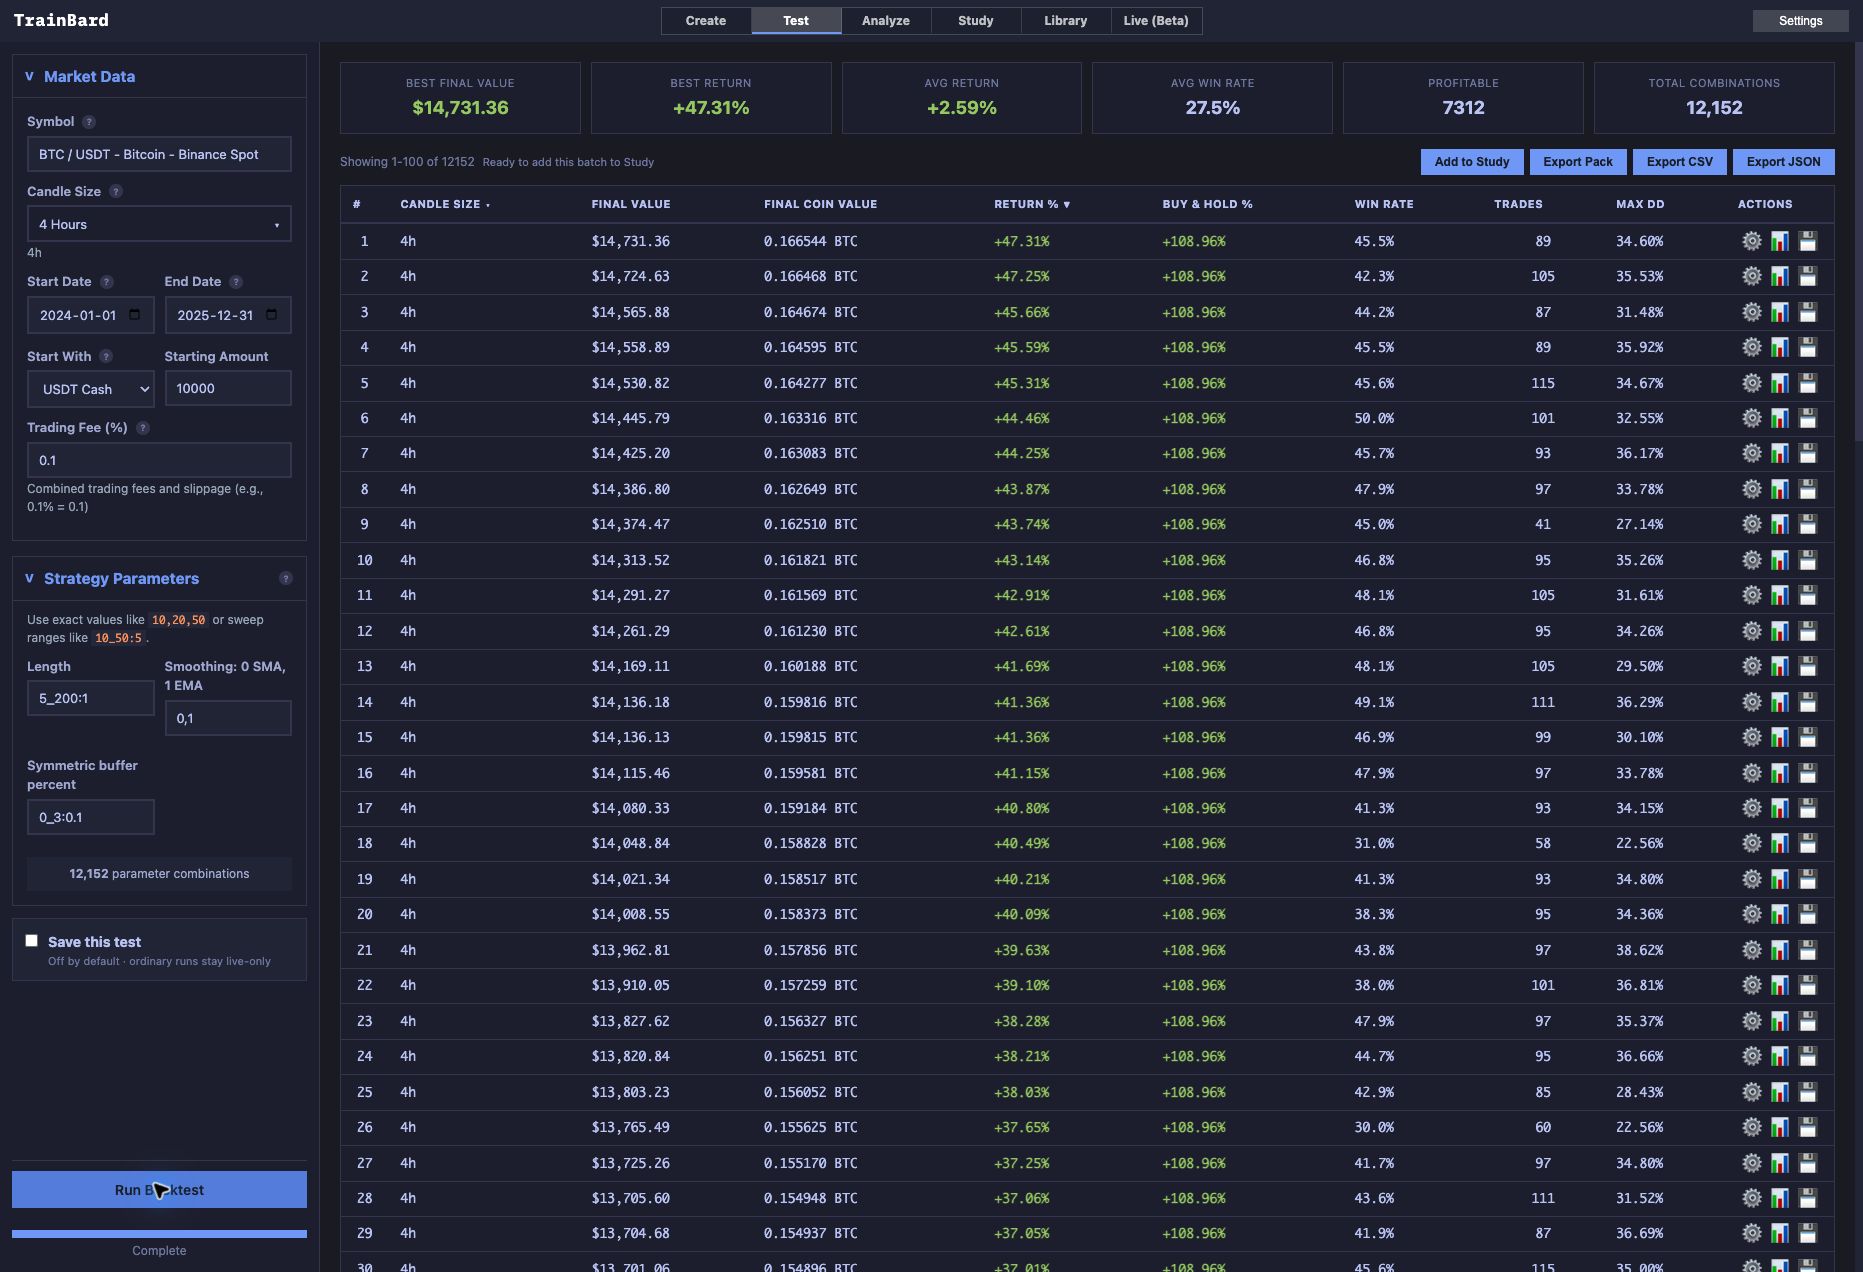
Original TrainBard completion for 12,152 EMA/SMA settings on the later BTCUSDT four-hour frame. This is one component of the full study, with dates, cost and grid visible.