Key takeaways
- CCI divides a price's distance from its rolling average by mean absolute deviation and a 0.015 scale constant; its value is not a percentage price change.
- For the standard same-window calculation, absolute CCI cannot exceed N divided by 0.03. A two-period CCI stays near ±66.67 when its prices differ, and a three-period CCI cannot strictly exceed ±100.
- At a 20-period lookback, about 60–62% of checked values lay between −100 and +100 in the historical samples. The scaling constant does not guarantee a fixed containment rate.
The Commodity Channel Index (CCI) measures how far a price sits from its recent average, relative to the spread of the same prices. Traders often watch +100 and −100 for strength or extreme conditions.
Our 144,936 configuration evaluations explore lookbacks, thresholds, and three entry rules. The calculation explains an important boundary: with only two periods, CCI cannot reach +100 at all. At twenty periods, the same threshold has a very different meaning.
What does the CCI indicator measure?
A positive CCI puts the latest source price above its rolling average. A negative CCI puts it below. Larger magnitudes mean a greater distance relative to the window’s mean absolute deviation.
Despite its name, CCI can be calculated for markets beyond commodities. A twenty-period example often uses typical price, the average of a candle’s high, low, and close. Platforms can offer other sources.
TradingView’s CCI guide explains the conventional calculation and the use of extreme readings for either trend strength or potential reversal. Those interpretations need separate trading rules.
How to calculate CCI
For a window of N source prices:
Typical price = (high + low + close) / 3
Mean          = average of the N typical prices
Mean deviation = average absolute distance from that mean

CCI = (latest typical price − mean)
      ÷ (0.015 × mean deviation)
The deviation uses each price’s distance from the same current window mean. It is not the average of historical one-bar changes or a standard deviation.
For two typical prices of 100 and 110, the mean is 105 and the mean absolute deviation is 5. CCI is 5 ÷ (0.015 × 5), or about 66.67.
Use 100 and 100.10 instead: the mean and deviation both shrink, leaving CCI at the same 66.67. The oscillator normalizes the move; 66.67 does not mean a 66.67% price increase.
Why two-period CCI cannot reach +100
With two unequal source prices, the latest value is always one mean-deviation unit above or below the mean. Standard CCI is therefore approximately +66.67 or −66.67. If the prices are equal, mean deviation is zero and the ratio needs a defined missing-value convention.
There is a more general limit when the latest observation belongs to the same calculation window:
Maximum absolute CCI = N / 0.03
The mean-centered deviations sum to zero. Their positive and negative totals must balance, so the total absolute deviation is at least twice the absolute newest deviation. Dividing by N and applying the 0.015 scale gives that bound.
The latest price is110 in every window. Its maximum normalized deviation grows with the number of observations.
The value table below is available without JavaScript.
Data and calculation details
Accessible value table (19 observations)
| Observation | CCI of the same newest price · CCI |
|---|---|
| 2 | 66.667 |
| 3 | 100.000 |
| 4 | 133.333 |
| 5 | 166.667 |
| 6 | 200.000 |
| 7 | 233.333 |
| 8 | 266.667 |
| 9 | 300.000 |
| 10 | 333.333 |
| 11 | 366.667 |
| 12 | 400.000 |
| 13 | 433.333 |
| 14 | 466.667 |
| 15 | 500.000 |
| 16 | 533.333 |
| 17 | 566.667 |
| 18 | 600.000 |
| 19 | 633.333 |
| 20 | 666.667 |
Every point above uses older prices of 100 and a newest price of 110, changing only the window length. The construction reaches the bound. At two observations it is 66.67; at three it is exactly 100. A rule requiring CCI strictly greater than 100 cannot qualify with three or fewer observations.
CCI is commonly called an unbounded oscillator because it has no fixed 0–100 range like RSI. That description does not remove the lookback-dependent limit of this particular same-window formula.
How the window changes a historical reading
The boundary is useful beyond a constructed example. A shorter CCI is not simply a quicker version with an otherwise identical scale.
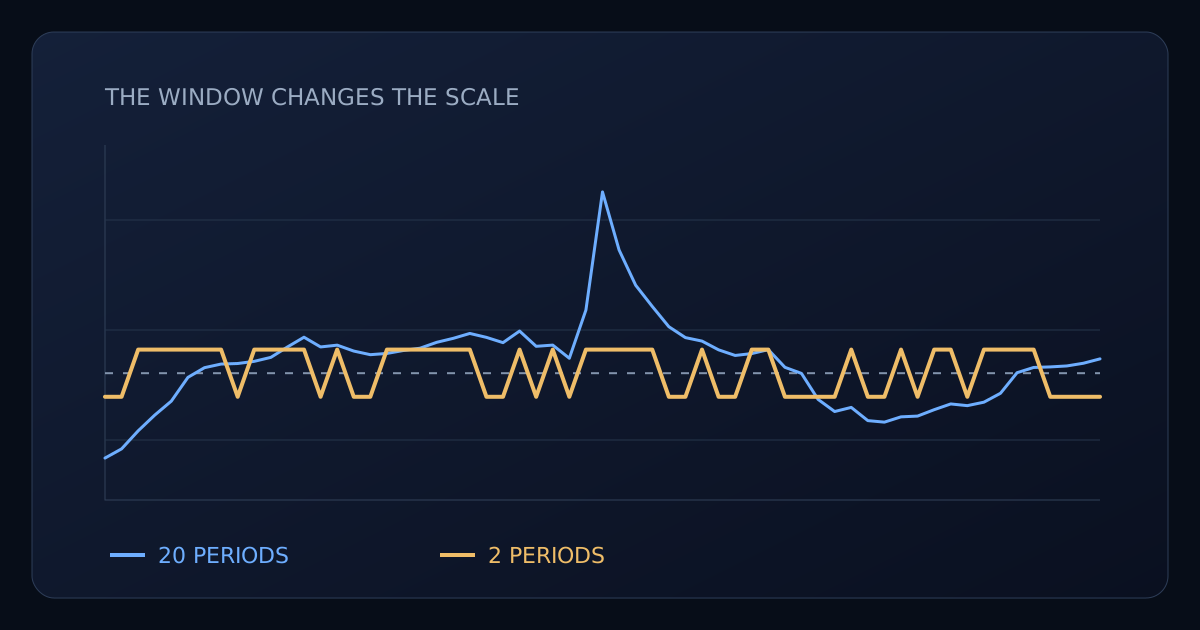
A selected high-CCI episode. A two-period calculation stays at approximately ±66.67 when its two source prices differ.
The value table below is available without JavaScript.
Data and calculation details
Accessible value table (61 observations)
| Observation | Closing price · Close | CCI on the same typical prices · 20 periods | CCI on the same typical prices · 2 periods |
|---|---|---|---|
| 2025-02-28T04:00:00Z | 79,973.790 | -239.962 | -66.667 |
| 2025-02-28T06:00:00Z | 79,204.590 | -213.971 | -66.667 |
| 2025-02-28T08:00:00Z | 80,343.110 | -162.946 | 66.667 |
| 2025-02-28T10:00:00Z | 80,513.380 | -118.467 | 66.667 |
| 2025-02-28T12:00:00Z | 81,512.420 | -78.950 | 66.667 |
| 2025-02-28T14:00:00Z | 84,005.050 | -11.861 | 66.667 |
| 2025-02-28T16:00:00Z | 83,605.120 | 15.589 | 66.667 |
| 2025-02-28T18:00:00Z | 84,449.990 | 25.792 | 66.667 |
| 2025-02-28T20:00:00Z | 84,258.370 | 27.360 | -66.667 |
| 2025-02-28T22:00:00Z | 84,349.940 | 33.507 | 66.667 |
| 2025-03-01T00:00:00Z | 84,656.930 | 44.694 | 66.667 |
| 2025-03-01T02:00:00Z | 85,330.840 | 74.059 | 66.667 |
| 2025-03-01T04:00:00Z | 85,588.190 | 101.676 | 66.667 |
| 2025-03-01T06:00:00Z | 84,740.150 | 74.214 | -66.667 |
| 2025-03-01T08:00:00Z | 85,380.000 | 79.233 | 66.667 |
| 2025-03-01T10:00:00Z | 84,632.790 | 62.552 | -66.667 |
| 2025-03-01T12:00:00Z | 84,532.240 | 52.317 | -66.667 |
| 2025-03-01T14:00:00Z | 84,800.000 | 55.833 | 66.667 |
| 2025-03-01T16:00:00Z | 85,214.700 | 64.230 | 66.667 |
| 2025-03-01T18:00:00Z | 85,485.410 | 70.630 | 66.667 |
| 2025-03-01T20:00:00Z | 86,076.860 | 87.231 | 66.667 |
| 2025-03-01T22:00:00Z | 86,064.530 | 98.515 | 66.667 |
| 2025-03-02T00:00:00Z | 86,354.930 | 112.384 | 66.667 |
| 2025-03-02T02:00:00Z | 85,873.070 | 101.271 | -66.667 |
| 2025-03-02T04:00:00Z | 85,957.510 | 86.366 | -66.667 |
| 2025-03-02T06:00:00Z | 86,232.420 | 119.120 | 66.667 |
| 2025-03-02T08:00:00Z | 85,901.300 | 76.017 | -66.667 |
| 2025-03-02T10:00:00Z | 86,105.890 | 79.387 | 66.667 |
| 2025-03-02T12:00:00Z | 85,710.810 | 42.208 | -66.667 |
| 2025-03-02T14:00:00Z | 87,427.990 | 178.611 | 66.667 |
| 2025-03-02T16:00:00Z | 94,093.750 | 512.429 | 66.667 |
| 2025-03-02T18:00:00Z | 93,522.000 | 348.378 | 66.667 |
| 2025-03-02T20:00:00Z | 94,298.000 | 248.641 | 66.667 |
| 2025-03-02T22:00:00Z | 94,270.000 | 188.774 | 66.667 |
| 2025-03-03T00:00:00Z | 93,084.640 | 131.417 | -66.667 |
| 2025-03-03T02:00:00Z | 92,709.980 | 100.582 | -66.667 |
| 2025-03-03T04:00:00Z | 93,344.000 | 90.738 | 66.667 |
| 2025-03-03T06:00:00Z | 92,363.580 | 66.044 | -66.667 |
| 2025-03-03T08:00:00Z | 91,847.760 | 50.115 | -66.667 |
| 2025-03-03T10:00:00Z | 92,739.990 | 55.493 | 66.667 |
| 2025-03-03T12:00:00Z | 93,586.830 | 66.546 | 66.667 |
| 2025-03-03T14:00:00Z | 90,035.370 | 16.612 | -66.667 |
| 2025-03-03T16:00:00Z | 90,300.010 | -0.742 | -66.667 |
| 2025-03-03T18:00:00Z | 85,606.000 | -74.086 | -66.667 |
| 2025-03-03T20:00:00Z | 85,374.330 | -108.368 | -66.667 |
| 2025-03-03T22:00:00Z | 86,220.610 | -96.762 | 66.667 |
| 2025-03-04T00:00:00Z | 83,380.550 | -134.094 | -66.667 |
| 2025-03-04T02:00:00Z | 83,983.720 | -138.403 | -66.667 |
| 2025-03-04T04:00:00Z | 84,273.990 | -123.450 | 66.667 |
| 2025-03-04T06:00:00Z | 83,186.400 | -121.288 | -66.667 |
| 2025-03-04T08:00:00Z | 83,748.000 | -103.192 | 66.667 |
| 2025-03-04T10:00:00Z | 83,937.940 | -86.935 | 66.667 |
| 2025-03-04T12:00:00Z | 82,804.000 | -91.783 | -66.667 |
| 2025-03-04T14:00:00Z | 82,985.060 | -81.938 | 66.667 |
| 2025-03-04T16:00:00Z | 85,443.890 | -56.738 | 66.667 |
| 2025-03-04T18:00:00Z | 88,206.190 | 1.388 | 66.667 |
| 2025-03-04T20:00:00Z | 87,517.490 | 16.208 | 66.667 |
| 2025-03-04T22:00:00Z | 87,281.980 | 17.751 | -66.667 |
| 2025-03-05T00:00:00Z | 87,643.110 | 20.449 | -66.667 |
| 2025-03-05T02:00:00Z | 86,843.400 | 28.128 | -66.667 |
| 2025-03-05T04:00:00Z | 87,145.980 | 40.438 | -66.667 |
The two-period curve stays near ±66.67 when its source values differ, while the twenty-period calculation can move beyond ±100. These are locally calculated indicator values, not backtest execution markers.
A high reading can persist as price keeps trending. A falling CCI can also result from the window average and deviation changing. It does not automatically mean the price itself fell.
Does the 0.015 constant keep 70–80% of values inside ±100?
That is a familiar description of the scaling convention, including in Fidelity’s CCI guide. It is not a distribution-free guarantee.
At a twenty-period lookback, about 60–62% of the checked historical values fell between −100 and +100 across our samples. Those observations include trending and ranging periods. The measured share belongs to those data and that formula.
Changing the 0.015 constant just rescales CCI. If a constant is multiplied by two, the same values are halved; halving the numerical threshold preserves the original inequality. Treating those paired changes as separate evidence would count the same decision twice.
Strength, fade, and recovery are different rules
The tests use a shared zero-line exit and three entries:
- Strength: buy while CCI is strictly above the positive threshold; exit below zero.
- Fade: buy while CCI is strictly below the negative threshold; exit at or above zero.
- Recovery: first require a strict below-threshold observation, then buy on recovery above it while still below zero; exit at or above zero.
One fixed rule and historical sample, changing only the displayed setting and line comparison. Each buy/sell is one execution.
The value table below is available without JavaScript.
Data and calculation details
Accessible value table (99 observations)
| Observation | Executions by lookback (bars) · Strength | Executions by lookback (bars) · Fade | Executions by lookback (bars) · Strict recovery |
|---|---|---|---|
| 2 | 0.000 | 0.000 | 0.000 |
| 3 | 0.000 | 0.000 | 0.000 |
| 4 | 2,388.000 | 2,467.000 | 2,066.000 |
| 5 | 1,988.000 | 2,067.000 | 1,746.000 |
| 6 | 1,746.000 | 1,792.000 | 1,526.000 |
| 7 | 1,564.000 | 1,604.000 | 1,364.000 |
| 8 | 1,433.000 | 1,422.000 | 1,244.000 |
| 9 | 1,305.000 | 1,294.000 | 1,146.000 |
| 10 | 1,209.000 | 1,192.000 | 1,084.000 |
| 11 | 1,099.000 | 1,108.000 | 1,024.000 |
| 12 | 1,027.000 | 1,054.000 | 972.000 |
| 13 | 949.000 | 996.000 | 912.000 |
| 14 | 883.000 | 938.000 | 866.000 |
| 15 | 861.000 | 886.000 | 812.000 |
| 16 | 812.000 | 810.000 | 748.000 |
| 17 | 772.000 | 760.000 | 704.000 |
| 18 | 728.000 | 730.000 | 686.000 |
| 19 | 698.000 | 710.000 | 664.000 |
| 20 | 674.000 | 674.000 | 624.000 |
| 21 | 652.000 | 648.000 | 596.000 |
| 22 | 630.000 | 620.000 | 570.000 |
| 23 | 612.000 | 596.000 | 556.000 |
| 24 | 596.000 | 574.000 | 532.000 |
| 25 | 576.000 | 562.000 | 522.000 |
| 26 | 566.000 | 546.000 | 512.000 |
| 27 | 540.000 | 520.000 | 486.000 |
| 28 | 520.000 | 492.000 | 458.000 |
| 29 | 506.000 | 474.000 | 446.000 |
| 30 | 496.000 | 468.000 | 440.000 |
| 31 | 474.000 | 452.000 | 428.000 |
| 32 | 458.000 | 446.000 | 420.000 |
| 33 | 448.000 | 439.000 | 415.000 |
| 34 | 434.000 | 423.000 | 399.000 |
| 35 | 418.000 | 415.000 | 395.000 |
| 36 | 402.000 | 411.000 | 391.000 |
| 37 | 382.000 | 399.000 | 379.000 |
| 38 | 374.000 | 389.000 | 373.000 |
| 39 | 374.000 | 383.000 | 367.000 |
| 40 | 362.000 | 381.000 | 365.000 |
| 41 | 356.000 | 379.000 | 363.000 |
| 42 | 342.000 | 373.000 | 355.000 |
| 43 | 334.000 | 367.000 | 351.000 |
| 44 | 328.000 | 361.000 | 345.000 |
| 45 | 322.000 | 351.000 | 335.000 |
| 46 | 320.000 | 349.000 | 335.000 |
| 47 | 314.000 | 343.000 | 331.000 |
| 48 | 312.000 | 335.000 | 319.000 |
| 49 | 310.000 | 325.000 | 313.000 |
| 50 | 302.000 | 317.000 | 307.000 |
| 51 | 292.000 | 315.000 | 309.000 |
| 52 | 290.000 | 319.000 | 313.000 |
| 53 | 282.000 | 309.000 | 305.000 |
| 54 | 280.000 | 307.000 | 303.000 |
| 55 | 272.000 | 301.000 | 295.000 |
| 56 | 266.000 | 299.000 | 293.000 |
| 57 | 260.000 | 297.000 | 291.000 |
| 58 | 262.000 | 293.000 | 287.000 |
| 59 | 258.000 | 291.000 | 283.000 |
| 60 | 252.000 | 291.000 | 283.000 |
| 61 | 240.000 | 285.000 | 277.000 |
| 62 | 238.000 | 289.000 | 283.000 |
| 63 | 232.000 | 283.000 | 279.000 |
| 64 | 236.000 | 277.000 | 273.000 |
| 65 | 232.000 | 271.000 | 267.000 |
| 66 | 230.000 | 269.000 | 265.000 |
| 67 | 228.000 | 267.000 | 263.000 |
| 68 | 228.000 | 263.000 | 259.000 |
| 69 | 224.000 | 257.000 | 253.000 |
| 70 | 218.000 | 255.000 | 251.000 |
| 71 | 218.000 | 249.000 | 245.000 |
| 72 | 218.000 | 241.000 | 237.000 |
| 73 | 220.000 | 241.000 | 237.000 |
| 74 | 216.000 | 243.000 | 239.000 |
| 75 | 214.000 | 243.000 | 239.000 |
| 76 | 216.000 | 241.000 | 237.000 |
| 77 | 214.000 | 233.000 | 229.000 |
| 78 | 208.000 | 231.000 | 227.000 |
| 79 | 208.000 | 225.000 | 223.000 |
| 80 | 204.000 | 217.000 | 217.000 |
| 81 | 200.000 | 213.000 | 213.000 |
| 82 | 190.000 | 207.000 | 207.000 |
| 83 | 190.000 | 205.000 | 205.000 |
| 84 | 184.000 | 205.000 | 205.000 |
| 85 | 182.000 | 209.000 | 209.000 |
| 86 | 178.000 | 205.000 | 205.000 |
| 87 | 176.000 | 205.000 | 205.000 |
| 88 | 172.000 | 203.000 | 203.000 |
| 89 | 170.000 | 203.000 | 203.000 |
| 90 | 162.000 | 201.000 | 201.000 |
| 91 | 160.000 | 199.000 | 199.000 |
| 92 | 158.000 | 199.000 | 199.000 |
| 93 | 158.000 | 197.000 | 197.000 |
| 94 | 158.000 | 197.000 | 197.000 |
| 95 | 154.000 | 193.000 | 193.000 |
| 96 | 152.000 | 187.000 | 187.000 |
| 97 | 154.000 | 183.000 | 183.000 |
| 98 | 148.000 | 179.000 | 179.000 |
| 99 | 150.000 | 177.000 | 177.000 |
| 100 | 152.000 | 177.000 | 177.000 |
In the displayed comparison, the strength rule recorded 2,388 executions at four periods, 674 at twenty, and 152 at one hundred. Neighboring lengths also produced occasional small increases in activity. Length changes the mean and mean deviation together, so it is more than a speed adjustment.
The threshold stays fixed in these additional tests using small positions. The three rules respond to different events, so their execution counts can separate even on the same indicator values. A recovery that jumps directly above zero is rejected because its exit already has priority.
The script also disables entries at thresholds at or beyond the exact bound. Those settings are valid cash outcomes by construction. Their lack of trades is not fresh empirical proof of the mathematics.
The full evidence preserves return and drawdown summaries as well as activity. The chart teaches what each rule selects; it does not identify a universally profitable CCI setting.
CCI versus RSI and useful settings
RSI summarizes smoothed upward and downward price changes on a fixed 0–100 scale. CCI compares a price level with a rolling mean and mean absolute deviation. A reading of 70 on one is not equivalent to 70 on the other.
Choose lookback and threshold together. Shortening the window can alter the available scale, the rate of extreme readings, and how often a recovery can happen. A conventional twenty-period setting is a starting point for a defined comparison, not a reason to assume ±100 has the same behavior everywhere.
Reproduce the comparison
The script defaults to twenty-period typical-price CCI and a +100 strength entry. Switch the rule to fade or strict recovery while keeping the same indicator and threshold.
//@version=6
strategy("CCI Lab: thresholds, continuation and recovery", overlay=false, initial_capital=10000, default_qty_type=strategy.percent_of_equity, default_qty_value=99, process_orders_on_close=false)

cci_length = input.int(20, "CCI lookback", minval=2, maxval=100)
threshold = input.int(100, "Absolute entry threshold", minval=25, maxval=325)
rule_mode = input.int(0, "Rule: 0 strength, 1 fade, 2 recovery", minval=0, maxval=2)

cci_value = ta.cci(hlc3, cci_length)
recovery = ta.crossover(cci_value, -threshold) and cci_value[1] < -threshold
// The newest observation belongs to the same mean-deviation window.
// A strict excursion cannot exceed the bound N / 0.03.
feasible = threshold < cci_length / 0.03 - 0.000001
ready = bar_index >= 500 and not na(cci_value) and feasible
enter_long = ready and (rule_mode == 0 ? cci_value > threshold : rule_mode == 1 ? cci_value < -threshold : recovery)
exit_long = ready and (rule_mode == 0 ? cci_value < 0 : cci_value >= 0)

plot(cci_value, "CCI", color=color.blue)
plot(threshold, "Upper threshold", color=color.orange)
plot(-threshold, "Lower threshold", color=color.green)
plot(0, "Mean", color=color.gray)
if exit_long and strategy.position_size > 0
    strategy.close("Long")
if enter_long and not exit_long and strategy.position_size == 0
    strategy.entry("Long", strategy.long)
Markets, settings, accounting, and reproducibility
The historical frame covers Binance Spot BTCUSDT and ETHUSDT, two-hour and four-hour candles, and 2021-01-01–2023-12-31 and 2024-01-01–2025-12-31. All eight frames use the same frozen settings; later results are retrospective replication, not a blind holdout.
The two BTCUSDT two-hour main frames were run through TrainBard’s MCP endpoint. Remaining main frames and the activity controls were run through its web interface with the same frozen scripts. Completed UI totals, exact parameter membership, settings snapshots, and original exports are reconciled before inclusion. Guarded cash configurations stay in the accepted denominator. Omitted zero-trade tuples provide execution counts of zero; absent return, drawdown, fee, and win-rate cells are not fabricated. Interface bridge checks are counted separately. The main study contains 140,701 observed metric rows and 4,235 valid UI-omitted zero tuples. Return and drawdown summaries use the observed rows only; cash-row coverage differs by interface.
Each frame has 18,117 configurations: every integer lookback from 2 through 100 (99), thresholds 25 through 325 in steps of 5 (61), and three entry rules. The main total is 144,936 accepted evaluations. Separate preparatory diagnostics are excluded. 2,376 additional fixed small-notional evaluations repeat the complete activity curves across the same eight frames. In those controls, each entry requests qty = 100 / signal close; actual next-open fill notional can differ. Their smaller requested size separates the displayed activity comparison from the broad sweeps’ equity-funding behavior. The exact activity-control script is retained separately; these confirmations are excluded from the main count. The control total contains 2,328 observed metric rows and 48 reconciled UI-omitted zero tuples. A local full-precision signal-state check matched 2,374 of the 2,376 control counts. Two four-period fade/recovery cases differed by one entry/exit pair; rounding the OHLC inputs to float32 reproduced their recorded counts. That is consistent with input precision affecting a strict comparison, without proving the platform’s internal cause. Published activity uses the recorded exports throughout.
The calculation is ta.cci(hlc3, length). All modes require the threshold to be strictly below length / 0.03, with a 0.000001 numerical margin. This prevents floating-point boundary comparisons from creating strict excursions outside the mathematical bound. It deliberately excludes boundary-only recovery rules: the final recovery requires the preceding value to be strictly below minus the threshold as well as a current crossover. Standard crossover definitions can accept equality at the preceding value; those are a different rule. The 696 guarded settings per frame, or 5,568 across the study, remain valid cash configurations in the main denominator. The accepted main results contain 5,646 zero-execution settings in total.
Every test starts at 10,000 USDT, stays in cash for 500 startup bars, requests 99% equity sizing, and uses 0.1% combined fee/slippage per execution. Entries require a flat position and exits require an open position, with exit priority. Signals use completed candles and request next-open market fills. No leverage or cash yield is used; remaining positions are valued at the end. The same 500-bar startup spans different elapsed time on the two candle sizes.
The sizing request does not guarantee a persistent 1% reserve under the platform’s returned fees and fills. Buy and sell orders each count as executions; totalTrades is not the number of closed positions. The endpoint includes the 00:00 UTC candle opening on the named end date. The execution and source audit retains detailed controls and fee/sizing checks.
Direct containment measurements use exact TrainBard-returned candles and exclude each frame’s first 500 bars. The 20-period share inside ±100 is 60.59–62.11% across frames. An official-archive crosscheck found small earlier-window differences preserved in the source audit; later-window teaching values matched that archive comparison.
The historical price/CCI chart selects the maximum post-startup twenty-period CCI above 200 in the BTCUSDT two-hour later frame. Its locally calculated values illustrate normalization and are not fills. The activity chart uses the fixed small-notional controls on the BTCUSDT two-hour early frame at threshold 100, showing the three rule families over the full lookback grid. Downloadable data retains canonical timestamps and exact settings.
The study evidence contains accepted counts, run identifiers, grids, zero-trade accounting, checksums, per-frame summaries, direct containment measurements, and selection provenance. The tested script accompanies it. Original requests, exports, and earlier diagnostic variants remain in the research archive.
Related settings and overlapping market histories are not independent statistical trials. Algebra establishes the bound; the historical tests describe how the specific entry rules behaved under the stated calculation and execution conventions.
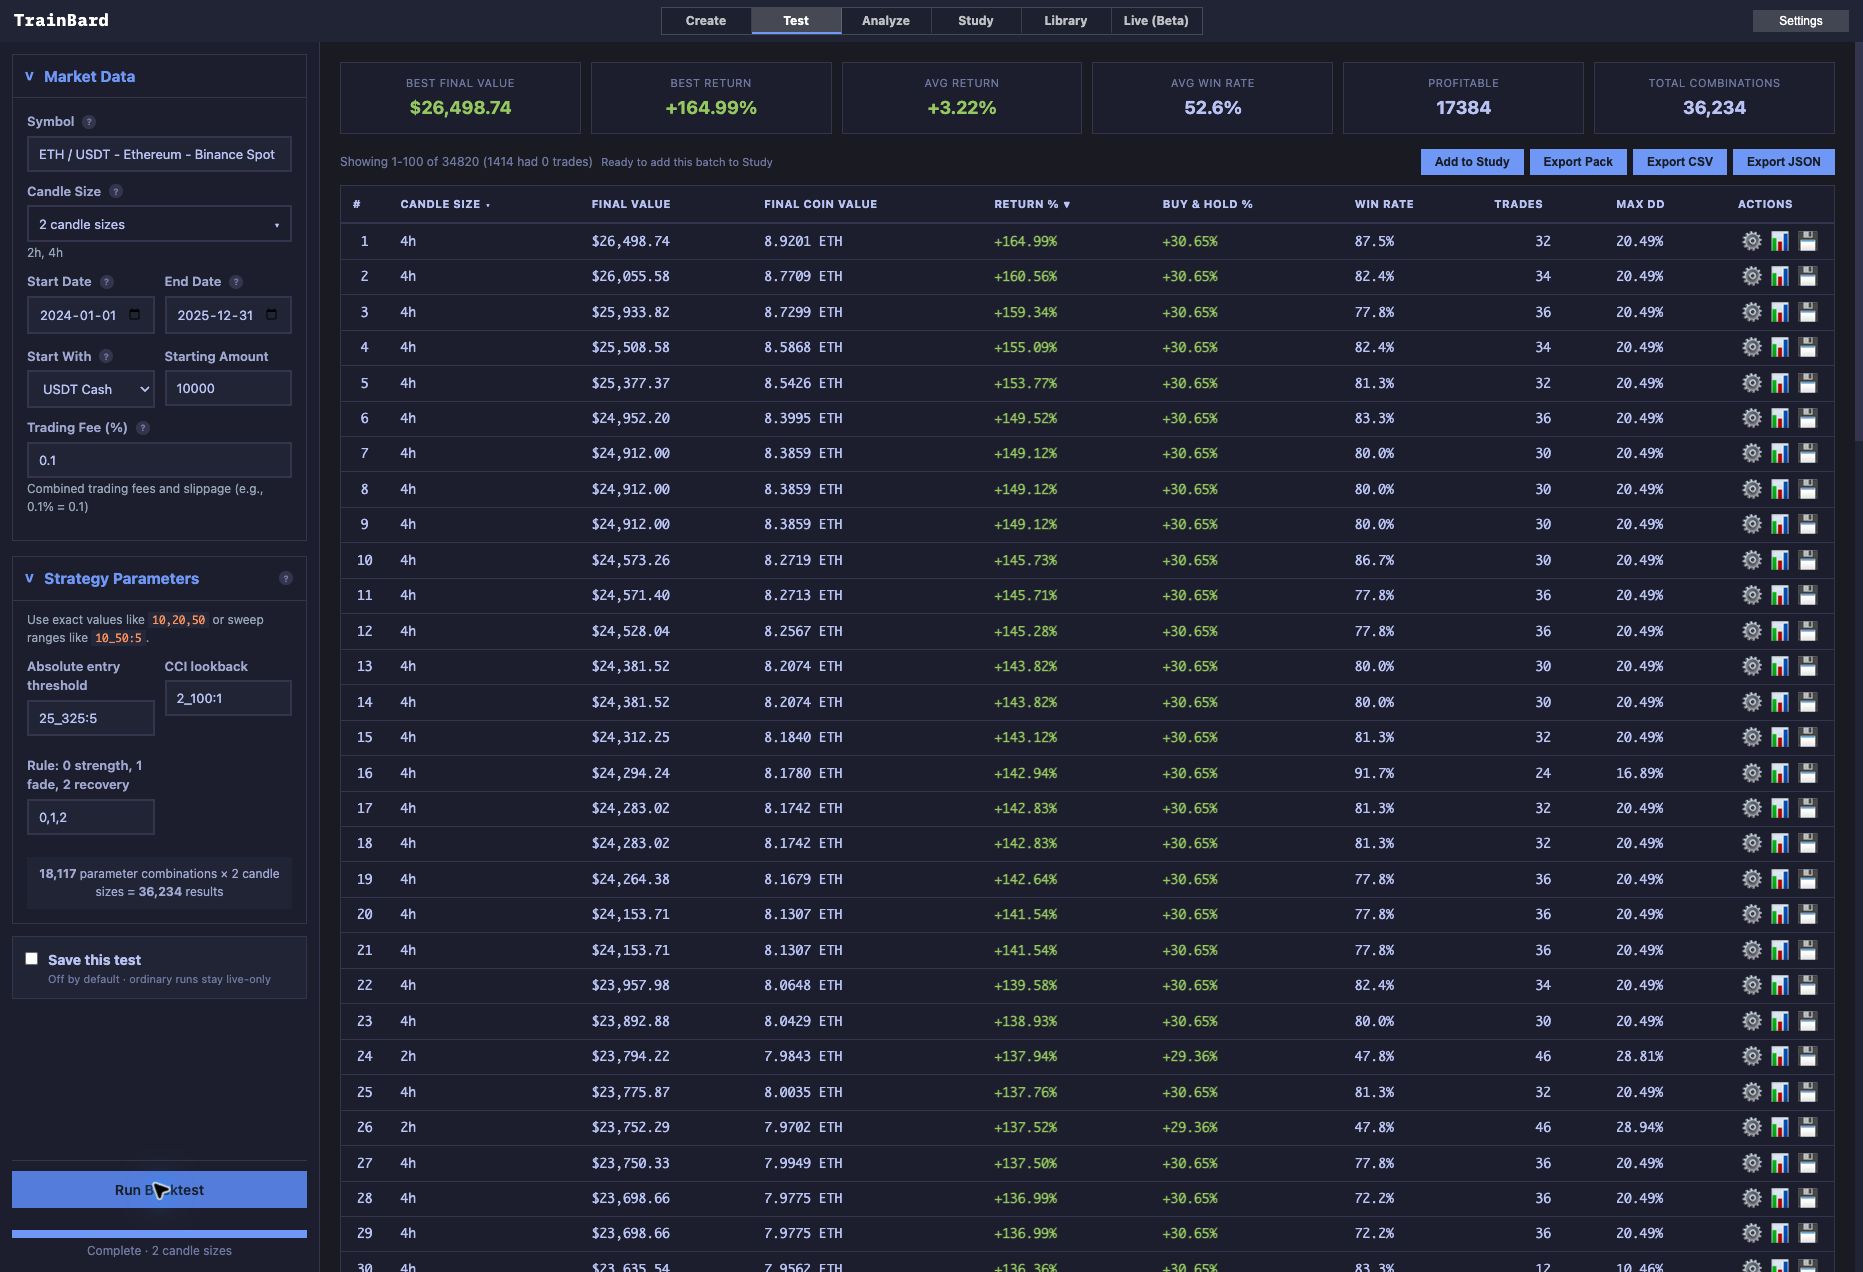
This original UI completion covers 36,234 settings on the later ETHUSDT two- and four-hour frames. It includes the deliberately guarded cash outcomes described above. The best displayed row is completion evidence, not a recommended setting.
Compare the fixed scale of RSI or the standard-deviation normalization of Bollinger Bands.