Key takeaways
- Bollinger Bands place boundaries based on price spread around a moving average; a band touch alone is not a trading signal.
- With population standard deviation calculated from the same window including the current close, a close strictly outside two-standard-deviation bands is impossible with five or fewer closes.
- A longer lookback can first increase and then reduce activity; an old price leaving can sharply narrow the bands. Historical activity patterns do not establish profitable signals.
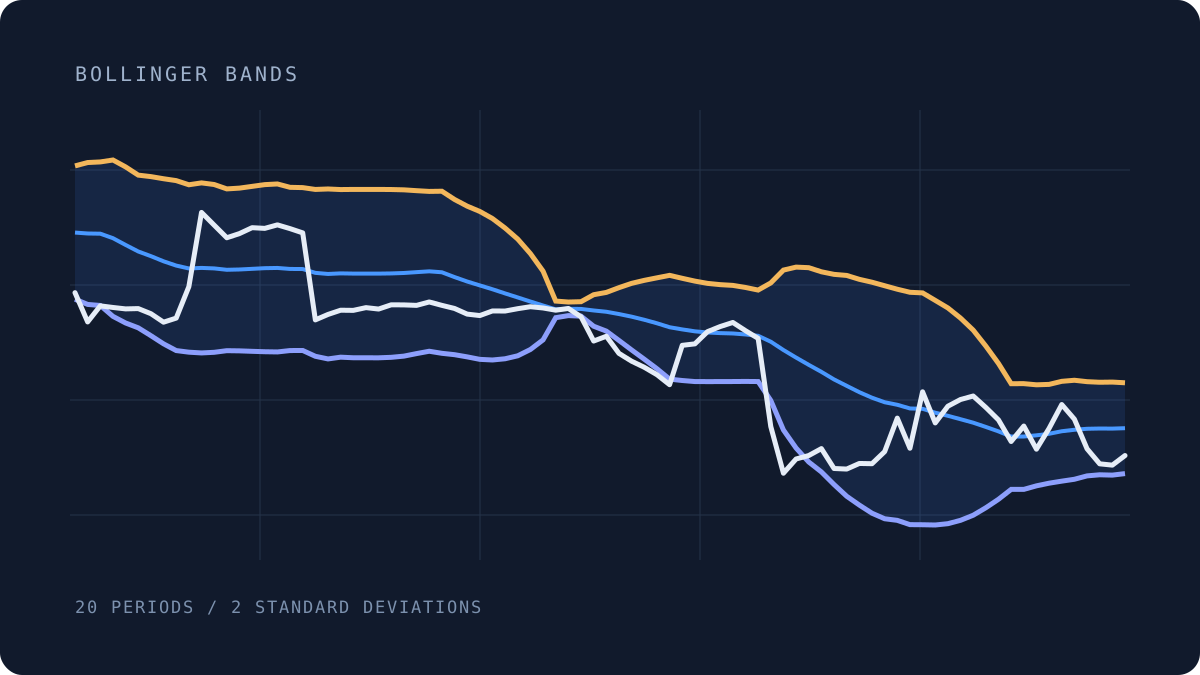
Bollinger Bands place an upper and lower band around a moving average. The bands widen when the prices in their calculation become more spread out and narrow when those prices become more similar.
Traders use them to read relative high and low prices, watch volatility, and define trading rules. Across 226,064 configuration evaluations, a longer lookback could produce more trades, while extending it further could reduce the count again. The current price also helps determine the boundary it is trying to cross.
What do Bollinger Bands show?
The middle line is usually a simple moving average. The outer lines sit a chosen number of standard deviations above and below it. Standard deviation measures how far the prices in the window spread around their average.
The familiar setting is 20 periods and two standard deviations, often written 20/2. Twenty periods means twenty candles: it covers different amounts of time on a two-hour chart and a daily chart. These are defaults, not universally best settings. Fidelity’s guide explains the conventional construction.
A high price relative to its recent window may be close to the upper band. A relatively low one may be close to the lower band. Neither description tells us whether the next move will continue or reverse.
%b expresses that relative position as (close − lower band) ÷ (upper band − lower band). When the width is nonzero, 0 is the lower band and 1 is the upper band; values outside 0–1 lie outside the bands.
How to calculate Bollinger Bands
For a lookback of N closing prices and a multiplier of k:
Middle band = SMA of the last N closes
Upper band  = middle band + k × standard deviation
Lower band  = middle band − k × standard deviation
Here we use population standard deviation: average the squared distances from the window’s mean, then take the square root. The current close belongs to that window.
For example, four closes of 100 followed by 110 have an average of 102 and a standard deviation of 4. With a multiplier of two, the upper band is 110 and the lower band is 94. The newest price has reached the upper band exactly.
The calculation uses the levels of the closing prices, rather than the standard deviation of percentage returns. Keeping that distinction clear helps explain why a steady trend can also create wide bands.
Common Bollinger Band signals
There are several familiar ways to use the same lines:
- A breakout rule follows strength beyond the upper band, looking for continuation.
- A fade rule buys weakness below the lower band, looking for a return toward the average.
- A recovery rule waits for the close to return above the current lower band before buying.
- A squeeze describes unusually narrow bands. Traders then watch for a subsequent move and its direction.
The bands also move, so returning above a lower band need not mean the close rose from the previous candle. A touch made by a candle’s high or low also differs from a close outside a band.
John Bollinger explicitly warns that a band tag alone is not a buy or sell signal. Prices can keep moving along a band during a trend. The use of two standard deviations also does not promise that 95% of future prices will remain inside.
Why a longer lookback can produce more activity
With the bands fixed at two standard deviations, one breakout comparison produced 452 executions at six closes, 608 at ten, and 432 at twenty. Extending the lookback first made the rule more active, then quieter. The same rise-then-fall pattern repeated across the studied samples for both breakout and fade rules.
Here, breakout means buying above the upper band and exiting below the middle line. Each buy or sell counts as one execution. The curve is not a count of every candle outside a band.
Changing only the lookback can first increase executions, then reduce them. The multiplier and breakout rule stay fixed.
The value table below is available without JavaScript.
Data and calculation details
Accessible value table (39 observations)
| Observation | Recorded executions · Breakout rule · 2σ |
|---|---|
| N = 2 | 0.000 |
| N = 3 | 0.000 |
| N = 4 | 0.000 |
| N = 5 | 0.000 |
| N = 6 | 452.000 |
| N = 7 | 570.000 |
| N = 8 | 602.000 |
| N = 9 | 646.000 |
| N = 10 | 608.000 |
| N = 11 | 585.000 |
| N = 12 | 545.000 |
| N = 13 | 535.000 |
| N = 14 | 509.000 |
| N = 15 | 484.000 |
| N = 16 | 458.000 |
| N = 17 | 460.000 |
| N = 18 | 458.000 |
| N = 19 | 442.000 |
| N = 20 | 432.000 |
| N = 21 | 428.000 |
| N = 22 | 412.000 |
| N = 23 | 402.000 |
| N = 24 | 388.000 |
| N = 25 | 392.000 |
| N = 26 | 376.000 |
| N = 27 | 354.000 |
| N = 28 | 336.000 |
| N = 29 | 336.000 |
| N = 30 | 328.000 |
| N = 31 | 318.000 |
| N = 32 | 310.000 |
| N = 33 | 304.000 |
| N = 34 | 290.000 |
| N = 35 | 284.000 |
| N = 36 | 278.000 |
| N = 37 | 266.000 |
| N = 38 | 256.000 |
| N = 39 | 244.000 |
| N = 40 | 240.000 |
These comparisons hold the multiplier and trading rule fixed while changing the lookback. They measure rule activity, rather than the quality of the resulting trades.
The interaction between length and width is established. Bollinger’s own rules suggest changing the multiplier when the average length changes if the goal is similar price containment. Holding it fixed here lets us measure how a lookback change affects these exact trading rules.
The band’s lookback changes both its center and its width. A longer window can make an outside close easier to achieve near the short-window boundary, while also changing how long an existing position lasts. The formula alone does not predict the resulting execution count.
Changing the entry rule changes the comparison again. Buying above the upper band and buying below the lower band are separate strategies, even when both use the familiar 20/2 display. Their default-setting results and broader summaries are retained with the evidence; none of these activity comparisons establishes a profitable rule.
Why very short bands can stop signaling
The latest close helps determine the boundary it is trying to cross. As that price moves away from the other closes, it pulls the average toward itself and increases the standard deviation.
The latest close stays at 110 as the lookback changes. At five closes the two-standard-deviation upper band exactly meets 110; at six it falls below it.
The value table below is available without JavaScript.
Data and calculation details
Accessible value table (24 observations)
| Observation | Same latest close, different window length · Latest close | Same latest close, different window length · Middle SMA | Same latest close, different window length · Upper band (2σ) |
|---|---|---|---|
| N = 2 | 110.000 | 105.000 | 115.000 |
| N = 3 | 110.000 | 103.333 | 112.761 |
| N = 4 | 110.000 | 102.500 | 111.160 |
| N = 5 | 110.000 | 102.000 | 110.000 |
| N = 6 | 110.000 | 101.667 | 109.120 |
| N = 7 | 110.000 | 101.429 | 108.427 |
| N = 8 | 110.000 | 101.250 | 107.864 |
| N = 9 | 110.000 | 101.111 | 107.397 |
| N = 10 | 110.000 | 101.000 | 107.000 |
| N = 11 | 110.000 | 100.909 | 106.659 |
| N = 12 | 110.000 | 100.833 | 106.361 |
| N = 13 | 110.000 | 100.769 | 106.099 |
| N = 14 | 110.000 | 100.714 | 105.865 |
| N = 15 | 110.000 | 100.667 | 105.656 |
| N = 16 | 110.000 | 100.625 | 105.466 |
| N = 17 | 110.000 | 100.588 | 105.294 |
| N = 18 | 110.000 | 100.556 | 105.137 |
| N = 19 | 110.000 | 100.526 | 104.992 |
| N = 20 | 110.000 | 100.500 | 104.859 |
| N = 21 | 110.000 | 100.476 | 104.735 |
| N = 22 | 110.000 | 100.455 | 104.621 |
| N = 23 | 110.000 | 100.435 | 104.513 |
| N = 24 | 110.000 | 100.417 | 104.413 |
| N = 25 | 110.000 | 100.400 | 104.319 |
Each point above is a separate constructed calculation. Keep the latest close at 110 and the older closes at 100, then change the number of closes in the window.
With five closes, 110 lies exactly on the two-standard-deviation upper band. With six, the upper band is about 109.12, so 110 is outside it. The latest price has not changed; its influence on the calculation has.
There is an exact limit behind this example:
Largest possible distance from the mean, in standard deviations
= square root of (N − 1)
For three closes that limit is about 1.41. For five it is 2. A rule requiring a close strictly beyond a two-standard-deviation band therefore cannot trigger with five or fewer closes.
This is established finite-sample geometry, related to Samuelson’s inequality. It applies when the same window, including the current close, supplies both the average and population standard deviation. It does not impose this limit on a candle’s high against close-based bands, or on a new price compared with yesterday’s bands.
With six closes, a two-standard-deviation crossing becomes possible. Possibility still tells us nothing about its frequency or profitability.
Why bands can narrow while the latest price barely changes
Every new close adds one price to the window and removes another. Sometimes the price leaving matters much more than the latest change.
Twenty-close Bollinger Bands at two population standard deviations. Watch the band width shrink as an older high close leaves the window.
The value table below is available without JavaScript.
Data and calculation details
Accessible value table (84 observations)
| Observation | Closing price and 20/2 bands · Close | Closing price and 20/2 bands · 20-period SMA | Closing price and 20/2 bands · Upper band (2σ) | Closing price and 20/2 bands · Lower band (2σ) | BandWidth (%) · BandWidth |
|---|---|---|---|---|---|
| 2025-12-11T00:00:00Z | 90,674.740 | 92,311.254 | 94,125.030 | 90,497.478 | 3.930 |
| 2025-12-11T02:00:00Z | 89,880.010 | 92,286.027 | 94,216.568 | 90,355.486 | 4.184 |
| 2025-12-11T04:00:00Z | 90,316.720 | 92,280.312 | 94,233.332 | 90,327.291 | 4.233 |
| 2025-12-11T06:00:00Z | 90,272.750 | 92,158.574 | 94,285.677 | 90,031.470 | 4.616 |
| 2025-12-11T08:00:00Z | 90,234.190 | 91,974.384 | 94,098.155 | 89,850.612 | 4.618 |
| 2025-12-11T10:00:00Z | 90,242.350 | 91,796.460 | 93,874.099 | 89,718.820 | 4.527 |
| 2025-12-11T12:00:00Z | 90,103.530 | 91,669.636 | 93,833.692 | 89,505.580 | 4.721 |
| 2025-12-11T14:00:00Z | 89,872.510 | 91,529.322 | 93,775.793 | 89,282.850 | 4.909 |
| 2025-12-11T16:00:00Z | 89,983.230 | 91,412.665 | 93,724.892 | 89,100.438 | 5.059 |
| 2025-12-11T18:00:00Z | 90,839.810 | 91,334.125 | 93,611.880 | 89,056.369 | 4.988 |
| 2025-12-11T20:00:00Z | 92,858.390 | 91,349.230 | 93,662.929 | 89,035.531 | 5.066 |
| 2025-12-11T22:00:00Z | 92,513.380 | 91,335.754 | 93,618.830 | 89,052.677 | 4.999 |
| 2025-12-12T00:00:00Z | 92,170.000 | 91,298.253 | 93,499.169 | 89,097.337 | 4.821 |
| 2025-12-12T02:00:00Z | 92,283.400 | 91,306.401 | 93,520.597 | 89,092.204 | 4.850 |
| 2025-12-12T04:00:00Z | 92,444.420 | 91,323.939 | 93,568.153 | 89,079.724 | 4.915 |
| 2025-12-12T06:00:00Z | 92,425.340 | 91,342.021 | 93,615.424 | 89,068.618 | 4.978 |
| 2025-12-12T08:00:00Z | 92,520.560 | 91,348.238 | 93,633.785 | 89,062.690 | 5.004 |
| 2025-12-12T10:00:00Z | 92,418.190 | 91,321.264 | 93,542.011 | 89,100.516 | 4.864 |
| 2025-12-12T12:00:00Z | 92,302.790 | 91,318.584 | 93,534.453 | 89,102.715 | 4.853 |
| 2025-12-12T14:00:00Z | 89,935.140 | 91,214.573 | 93,484.481 | 88,944.664 | 4.977 |
| 2025-12-12T16:00:00Z | 90,083.090 | 91,184.990 | 93,497.294 | 88,872.686 | 5.072 |
| 2025-12-12T18:00:00Z | 90,198.220 | 91,200.901 | 93,481.227 | 88,920.574 | 5.001 |
| 2025-12-12T20:00:00Z | 90,193.940 | 91,194.762 | 93,485.215 | 88,904.308 | 5.023 |
| 2025-12-12T22:00:00Z | 90,268.420 | 91,194.545 | 93,485.347 | 88,903.743 | 5.024 |
| 2025-12-13T00:00:00Z | 90,229.910 | 91,194.331 | 93,485.493 | 88,903.169 | 5.025 |
| 2025-12-13T02:00:00Z | 90,345.540 | 91,199.491 | 93,482.504 | 88,916.477 | 5.007 |
| 2025-12-13T04:00:00Z | 90,342.910 | 91,211.460 | 93,473.781 | 88,949.138 | 4.961 |
| 2025-12-13T06:00:00Z | 90,329.970 | 91,234.333 | 93,450.829 | 89,017.836 | 4.859 |
| 2025-12-13T08:00:00Z | 90,422.570 | 91,256.300 | 93,431.079 | 89,081.520 | 4.766 |
| 2025-12-13T10:00:00Z | 90,330.360 | 91,230.827 | 93,436.241 | 89,025.413 | 4.835 |
| 2025-12-13T12:00:00Z | 90,245.870 | 91,100.201 | 93,212.033 | 88,988.369 | 4.636 |
| 2025-12-13T14:00:00Z | 90,092.160 | 90,979.140 | 93,029.756 | 88,928.524 | 4.508 |
| 2025-12-13T16:00:00Z | 90,052.610 | 90,873.271 | 92,885.298 | 88,861.243 | 4.428 |
| 2025-12-13T18:00:00Z | 90,178.160 | 90,768.009 | 92,692.294 | 88,843.723 | 4.240 |
| 2025-12-13T20:00:00Z | 90,175.970 | 90,654.586 | 92,432.069 | 88,877.103 | 3.921 |
| 2025-12-13T22:00:00Z | 90,240.010 | 90,545.320 | 92,132.440 | 88,958.199 | 3.506 |
| 2025-12-14T00:00:00Z | 90,293.290 | 90,433.956 | 91,738.461 | 89,129.451 | 2.885 |
| 2025-12-14T02:00:00Z | 90,258.980 | 90,325.996 | 91,260.767 | 89,391.224 | 2.070 |
| 2025-12-14T04:00:00Z | 90,199.060 | 90,220.809 | 90,447.126 | 89,994.492 | 0.502 |
| 2025-12-14T06:00:00Z | 90,245.600 | 90,236.332 | 90,420.878 | 90,051.786 | 0.409 |
| 2025-12-14T08:00:00Z | 90,020.060 | 90,233.181 | 90,429.842 | 90,036.519 | 0.436 |
| 2025-12-14T10:00:00Z | 89,360.000 | 90,191.270 | 90,620.098 | 89,762.441 | 0.951 |
| 2025-12-14T12:00:00Z | 89,489.500 | 90,156.048 | 90,682.760 | 89,629.335 | 1.168 |
| 2025-12-14T14:00:00Z | 89,022.910 | 90,093.772 | 90,812.234 | 89,375.310 | 1.595 |
| 2025-12-14T16:00:00Z | 88,810.670 | 90,022.810 | 90,929.236 | 89,116.384 | 2.014 |
| 2025-12-14T18:00:00Z | 88,644.880 | 89,937.777 | 91,010.900 | 88,864.654 | 2.386 |
| 2025-12-14T20:00:00Z | 88,443.850 | 89,842.824 | 91,079.378 | 88,606.270 | 2.753 |
| 2025-12-14T22:00:00Z | 88,172.170 | 89,734.934 | 91,146.763 | 88,323.105 | 3.147 |
| 2025-12-15T00:00:00Z | 89,242.320 | 89,675.922 | 91,066.351 | 88,285.492 | 3.101 |
| 2025-12-15T02:00:00Z | 89,282.600 | 89,623.534 | 90,990.135 | 88,256.932 | 3.050 |
| 2025-12-15T04:00:00Z | 89,615.240 | 89,592.002 | 90,928.481 | 88,255.523 | 2.983 |
| 2025-12-15T06:00:00Z | 89,753.420 | 89,575.065 | 90,894.234 | 88,255.896 | 2.945 |
| 2025-12-15T08:00:00Z | 89,865.120 | 89,565.691 | 90,873.770 | 88,257.611 | 2.921 |
| 2025-12-15T10:00:00Z | 89,641.280 | 89,538.847 | 90,817.248 | 88,260.445 | 2.856 |
| 2025-12-15T12:00:00Z | 89,432.000 | 89,501.648 | 90,746.587 | 88,256.709 | 2.782 |
| 2025-12-15T14:00:00Z | 87,033.220 | 89,341.309 | 90,940.255 | 87,742.362 | 3.579 |
| 2025-12-15T16:00:00Z | 85,762.870 | 89,114.788 | 91,289.913 | 86,939.662 | 4.882 |
| 2025-12-15T18:00:00Z | 86,149.960 | 88,909.337 | 91,370.746 | 86,447.927 | 5.537 |
| 2025-12-15T20:00:00Z | 86,243.780 | 88,711.573 | 91,355.520 | 86,067.625 | 5.961 |
| 2025-12-15T22:00:00Z | 86,432.080 | 88,520.897 | 91,243.688 | 85,798.105 | 6.152 |
| 2025-12-16T00:00:00Z | 85,891.020 | 88,314.445 | 91,173.965 | 85,454.924 | 6.476 |
| 2025-12-16T02:00:00Z | 85,875.920 | 88,140.241 | 91,144.590 | 85,135.891 | 6.817 |
| 2025-12-16T04:00:00Z | 86,028.110 | 87,967.171 | 91,038.721 | 84,895.621 | 6.983 |
| 2025-12-16T06:00:00Z | 86,021.510 | 87,817.101 | 90,960.115 | 84,674.087 | 7.158 |
| 2025-12-16T08:00:00Z | 86,350.000 | 87,694.068 | 90,864.403 | 84,523.732 | 7.230 |
| 2025-12-16T10:00:00Z | 87,261.450 | 87,624.896 | 90,769.497 | 84,480.295 | 7.177 |
| 2025-12-16T12:00:00Z | 86,443.020 | 87,524.855 | 90,686.137 | 84,363.572 | 7.224 |
| 2025-12-16T14:00:00Z | 87,977.430 | 87,515.118 | 90,669.558 | 84,360.677 | 7.209 |
| 2025-12-16T16:00:00Z | 87,131.990 | 87,409.601 | 90,465.525 | 84,353.677 | 6.992 |
| 2025-12-16T18:00:00Z | 87,585.770 | 87,324.760 | 90,259.799 | 84,389.720 | 6.722 |
| 2025-12-16T20:00:00Z | 87,768.590 | 87,232.427 | 89,983.880 | 84,480.974 | 6.308 |
| 2025-12-16T22:00:00Z | 87,863.420 | 87,137.927 | 89,656.522 | 84,619.332 | 5.781 |
| 2025-12-17T00:00:00Z | 87,552.300 | 87,022.286 | 89,221.526 | 84,823.046 | 5.054 |
| 2025-12-17T02:00:00Z | 87,213.590 | 86,900.902 | 88,748.390 | 85,053.413 | 4.252 |
| 2025-12-17T04:00:00Z | 86,626.390 | 86,760.621 | 88,198.772 | 85,322.470 | 3.315 |
| 2025-12-17T06:00:00Z | 87,045.590 | 86,761.240 | 88,199.869 | 85,322.610 | 3.316 |
| 2025-12-17T08:00:00Z | 86,417.460 | 86,793.969 | 88,168.618 | 85,419.320 | 3.168 |
| 2025-12-17T10:00:00Z | 86,983.260 | 86,835.634 | 88,179.856 | 85,491.412 | 3.096 |
| 2025-12-17T12:00:00Z | 87,631.370 | 86,905.014 | 88,263.048 | 85,546.979 | 3.125 |
| 2025-12-17T14:00:00Z | 87,233.440 | 86,945.082 | 88,292.181 | 85,597.982 | 3.099 |
| 2025-12-17T16:00:00Z | 86,427.120 | 86,971.887 | 88,253.780 | 85,689.993 | 2.948 |
| 2025-12-17T18:00:00Z | 86,018.530 | 86,979.017 | 88,237.824 | 85,720.210 | 2.895 |
| 2025-12-17T20:00:00Z | 85,982.880 | 86,976.756 | 88,242.531 | 85,710.980 | 2.911 |
| 2025-12-17T22:00:00Z | 86,243.220 | 86,987.841 | 88,223.484 | 85,752.198 | 2.841 |
Select The older high remains in the window, then A small price change, much narrower bands. The close falls by about 0.07%, while BandWidth narrows from 2.07% to 0.50% as an older high leaves the twenty-close window.
BandWidth is the distance between the outer bands divided by the middle band, expressed here as a percentage. The chart shows the changing indicator values without execution markers.
The window has become much more compact. That is useful information, but a sudden narrowing does not by itself establish a new change in the market’s direction. Bollinger’s own rules already describe this window effect; the example makes its arithmetic visible.
How we checked the behavior
The 226,064 main configuration evaluations varied lookback and band width for breakout and fade rules. The full settings, sources, and paired comparisons are recorded below.
Settings, accounting, and reproducibility
The study covered Binance Spot Bitcoin and Ether, two- and four-hour candles, and the historical windows 2021–2023 and 2024–2025. These are the eight datasets used for replication.
The activity chart foregrounds the Bitcoin two-hour 2021–2023 breakout curve: this is the 452→608→432 example in the text. The complete chart-data download retains both markets and periods: its panels are Bitcoin then Ether, both on two-hour candles; within each panel, the first curve is 2021–2023 and the second is 2024–2025. The periods cover different amounts of calendar time, so comparisons concern changes within each curve.
| Dataset | Length 6 | Length 10 | Length 20 |
|---|---|---|---|
| BTC · 2h · 2021–2023 | 452 | 608 | 432 |
| BTC · 2h · 2024–2025 | 256 | 391 | 310 |
| BTC · 4h · 2021–2023 | 230 | 294 | 186 |
| BTC · 4h · 2024–2025 | 142 | 214 | 138 |
| ETH · 2h · 2021–2023 | 462 | 608 | 408 |
| ETH · 2h · 2024–2025 | 300 | 404 | 298 |
| ETH · 4h · 2021–2023 | 224 | 254 | 200 |
| ETH · 4h · 2024–2025 | 162 | 202 | 148 |
Both breakout and fade rules increased executions from six to ten closes, then reduced them from ten to twenty, in all eight datasets. All sixteen rule-and-dataset comparisons remain in the measurement file.
Each frame used the same frozen grid: every lookback from 2 through 200; multipliers from 0.5 through 4 in steps of 0.05; and two entry rules. That is 28,258 valid configurations per frame. The two candle sizes were grouped into four completed batches of 56,516 evaluations.
Each evaluation started with 10,000 USDT and used no leverage. A long entry used a 99% equity budget, leaving a 1% cash reserve for next-open price changes. The combined fee/slippage setting was 0.1% per execution. The first 500 bars of each selected window were startup bars in cash. Larger candles therefore use more elapsed startup time as well as more time in each lookback. Idle cash earned no yield. Any remaining position was valued at the final close.
The breakout rule entered when the close was above the upper band and exited below the middle line. The fade rule entered below the lower band and exited at or above the middle. These conditions were checked at candle closes. The script requested next-bar market execution.
The script closes only an existing position and enters only while flat. These two rule families cannot ask for entry and exit on the same close.
The selected date endpoints run from 00:00 UTC on the start date through the candle opening at 00:00 UTC on the end date. They do not include the rest of the final calendar day. The platform full-window holding figure is the price return from the first close to the last close, before costs. The tested rules remain in cash through startup. Separate passive controls buy once after the same startup, with the same 99% allocation and entry cost, then hold. The evidence reports both all valid configurations and traded configurations above those controls: a zero-trade cash outcome can beat a negative passive return without trading.
Profit also needs a reference point. Across the later Bitcoin datasets, 44,030 of 56,516 configurations finished above their initial cash. 5,849 beat a passive control with the same 500-bar startup, 99% allocation, and entry cost; none beat the platform’s full-window buy-and-hold return. The full-window comparator starts at the first close. Changing when holding begins materially changes the comparison. These counts describe related historical settings; they do not validate an edge on new data.
The script explicitly prevents entries when k² is greater than or equal to N−1. That guard enforces the mathematical limit and avoids numerical boundary artefacts. Those configurations remain valid cash outcomes in the accounting. Their zero trades are not independent empirical confirmation of the identity.
The completed batches contain 219,088 exported traded rows and 6,976 valid settings with zero trades omitted from the exports. Joint batch totals and zero-trade counts were reconciled before splitting the candle sizes. Exact parameter tuples, including candle size, were checked for duplicate or conflicting rows. The guard accounts for 802 structurally inactive settings per frame; additional feasible settings can also have no trades in a selected historical window.
Preparatory boundary checks and execution diagnostics are retained in the research archive and excluded from the main evaluation count. Raw files and script versions are identified by SHA-256 checksums.
A separate trace check compared all 594 recorded executions from the Bitcoin two-hour 20/2 controls with official Binance next-open prices and the preceding-close signal conditions. All 594 matched the official open price to display precision and had the appropriate preceding-close condition.
These are related configuration evaluations sharing prices and many trades, not independent statistical trials. The later historical window checks the same grid; it is not prospective testing. Adjacent settings and replication help describe the behavior without establishing an edge in untested markets.
The historical window-memory example uses official Binance Spot BTCUSDT two-hour candles from 11–17 December 2025. Its indicator values were calculated locally. The selected adjacent closes move by less than 0.1%; the example illustrates window composition rather than a representative event frequency. The exact source, timestamps, values, and selection method remain in its candle provenance.
The tested Pine script, measurement and provenance file, and completed batch screenshot accompany the article. The historical chart has its own candle provenance. Original exports, diagnostic checks, and checksums remain in the research archive.
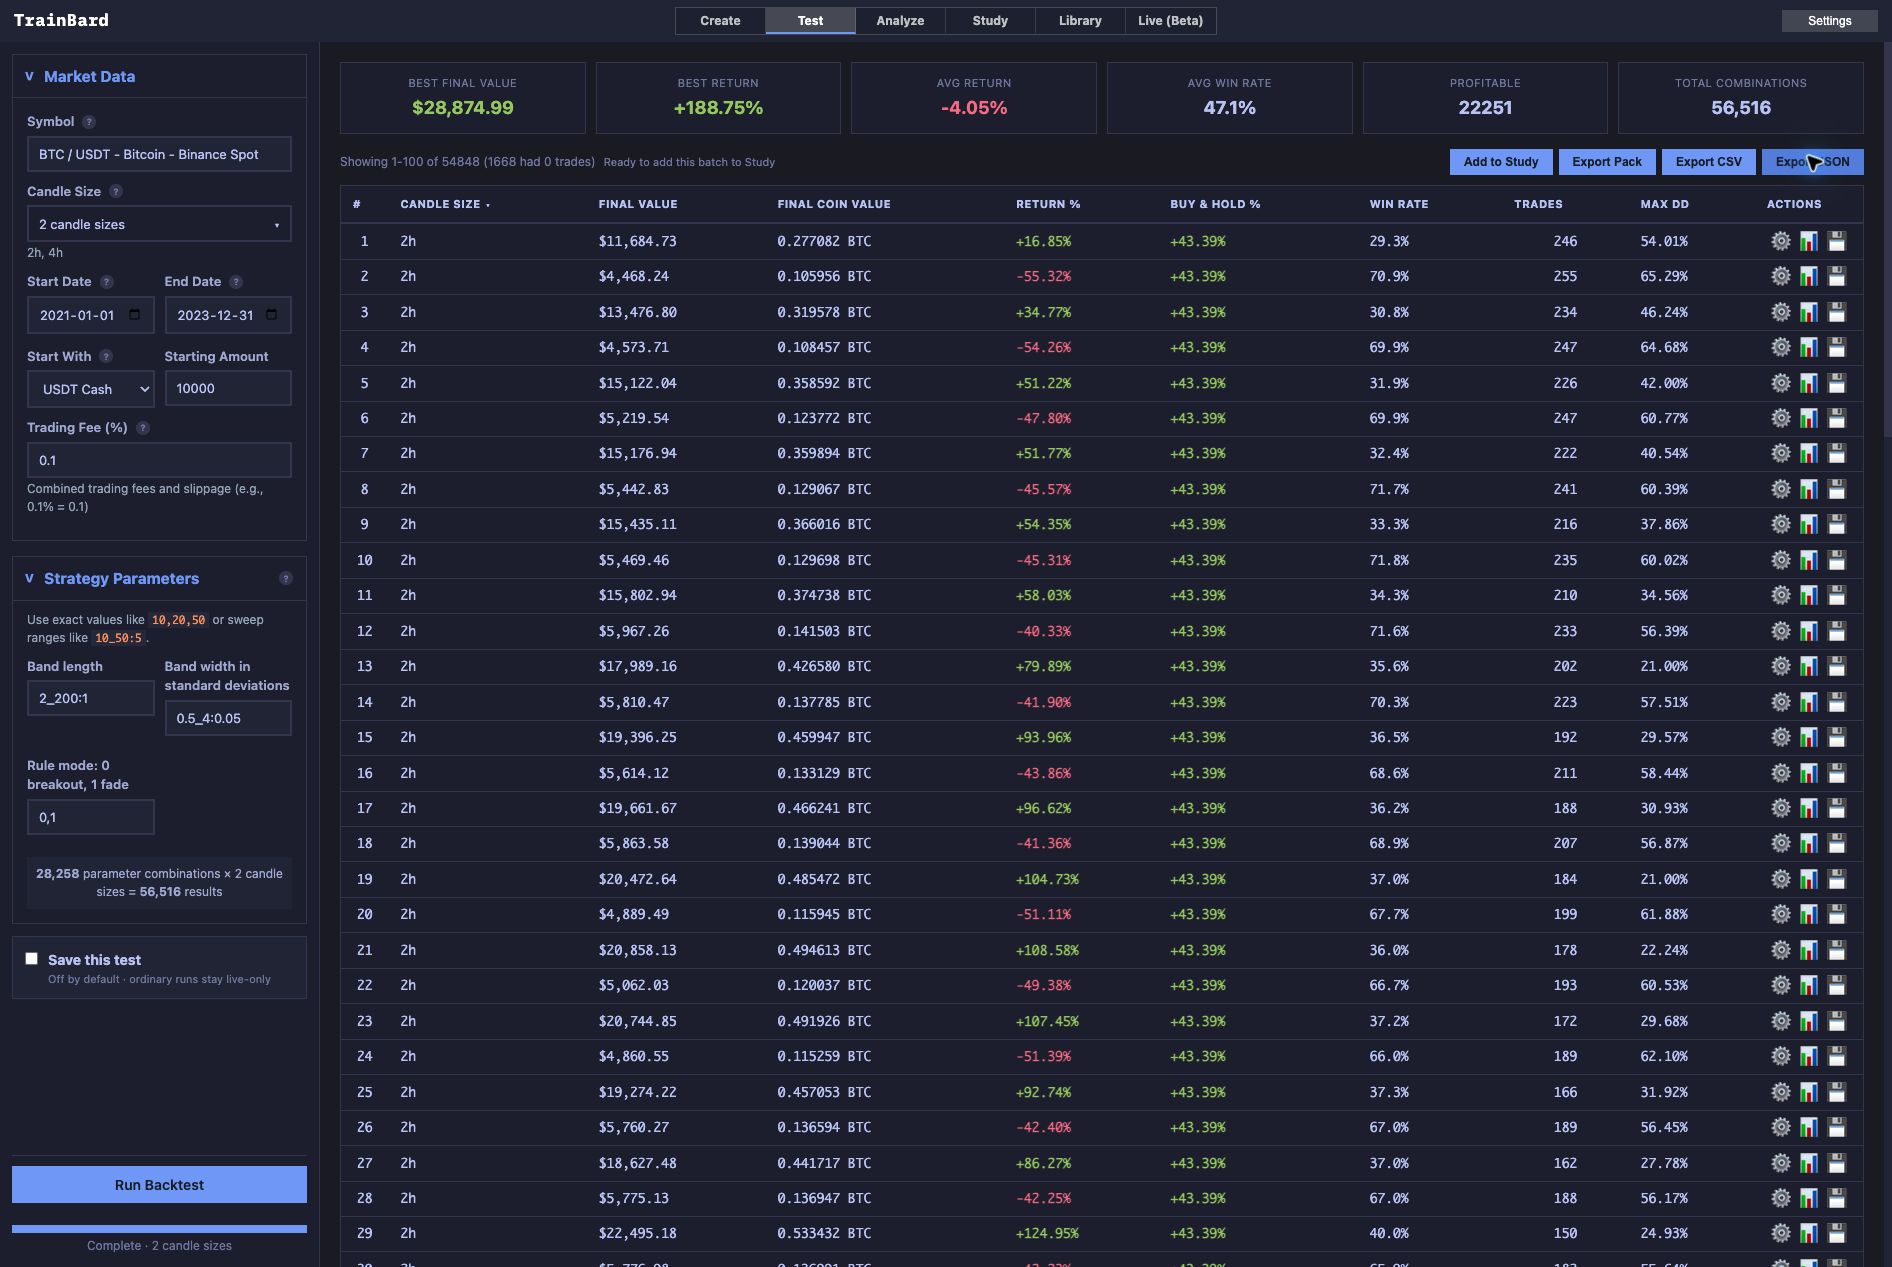
To explore the same effect, open TrainBard with the supplied script. Hold the multiplier and rule fixed while changing the lookback. Then keep the bands fixed and compare the entry rules: the indicator supplies the boundaries, while the rule determines the decisions.
For another measure of volatility, see our ATR guide. Related indicator guides cover the simple moving average, RSI, and MACD.