Key takeaways
- ATR measures the size of price movement in price units; ATR divided by price expresses that movement as a percentage.
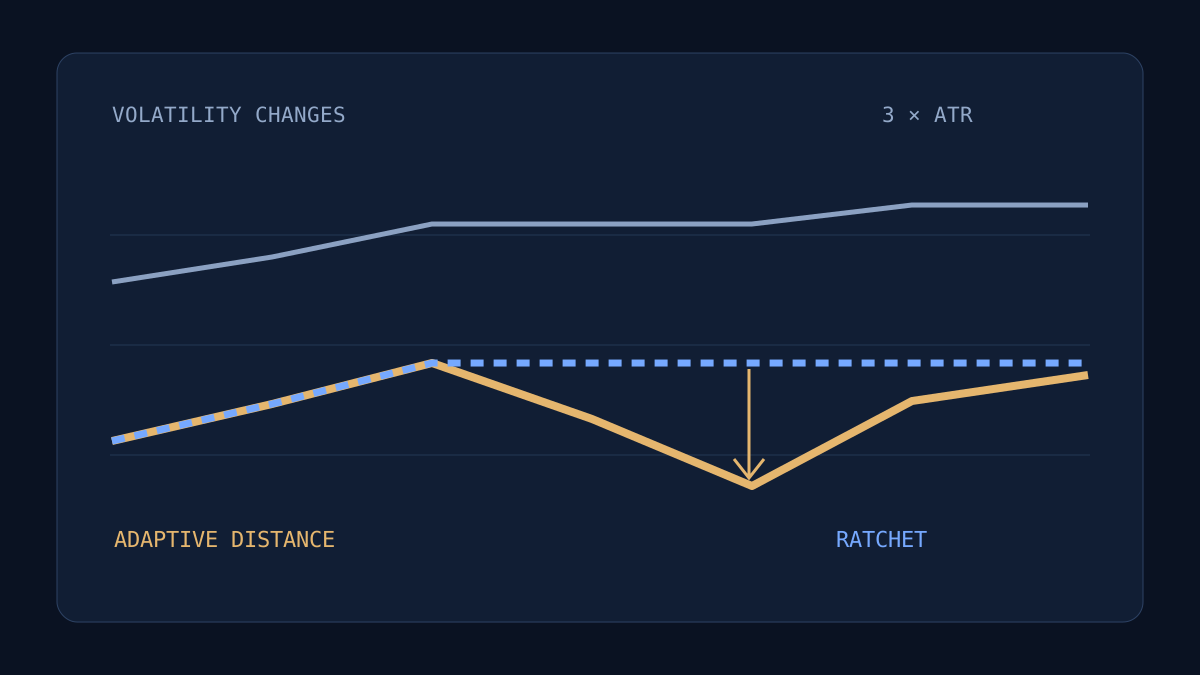
- A highest-close-minus-current-ATR line can fall when volatility rises. A separate ratchet is needed to prevent a long-position stop from moving lower.
- Historical tests found that changing the stop formula changed exit outcomes without consistently improving returns; a tighter line does not guarantee a safer realized trade.
Average True Range (ATR) measures how much a market has been moving. A rising ATR can accompany a rise or a fall in price. It supplies a volatility scale, so a trading rule still needs a separate way to choose direction.
The familiar 14-period setting appears in many chart packages. Traders also use multiples of ATR to describe stop distances. Across 104,160 historical configuration evaluations, we examined a detail that can disappear behind that shorthand: a line described as an ATR trail can move farther away from price when volatility expands.
How ATR is calculated
Start with the true range of each candle:
True range = largest of:
    high − low
    absolute value of (high − previous close)
    absolute value of (low − previous close)
Including the previous close lets true range account for a gap. If a candle has a high of 101, a low of 99, and a previous close of 95, its high–low range is 2 but its true range is 6.
The customary ATR calculation smooths these true ranges using Wilder’s update. For ATR 14, after initialization:
ATR now = (13 × previous ATR + current true range) ÷ 14
TradingView’s ATR reference describes true range and its default Wilder-style smoothing. The number 14 counts chart candles, so the same setting spans different elapsed time on hourly and daily charts.
ATR is a distance; ATR percentage puts it in context
An ATR of 2 means two price units. It does not mean 2%, and it does not say that the next candle will move exactly two units.
To express the distance relative to price:
ATR percentage = 100 × ATR ÷ closing price

ATR 2 at price 100 → 2%
ATR 2 at price 1,000 → 0.2%
TradingView’s ATR percentage explanation uses this normalization. Raw ATR values across differently priced markets are difficult to compare; expressing each as a percentage puts their scale in context.
A longer ATR length changes how quickly the distance reacts. A larger multiplier changes how far away the rule places its line. Those are separate choices. The familiar 14-period length does not make a 2× or 3× distance universally appropriate.
Common uses of ATR
ATR is used to describe unusually large movement, scale a breakout threshold, choose a stop distance, or help relate position size to a specified risk budget. Fidelity’s ATR guide discusses volatility and distance-based rules.
Position size and stop distance remain different decisions. If the distance doubles while quantity stays unchanged, the amount exposed to that distance doubles too. Our study keeps the allocation rule fixed; it does not test an ATR position-sizing system.
A volatility reading also supplies no built-in directional signal. We used a separate moving-average entry so that the experiment could focus on the exit formulas.
An ATR trail needs a rule about moving backward
Consider this long-position exit line:
Anchor = higher of recorded entry price and highest close since entry
Adaptive line = anchor − multiple × current ATR
The anchor cannot decline while the position stays open. Including the entry price matters when an opening gap places the fill above the subsequent closes. The ATR distance can still grow. If ATR rises enough, subtracting that larger distance makes the line fall.
A ratchet adds a second rule:
Ratcheted line = higher of:
    previous ratcheted line
    current adaptive line
The highest close stays at 104 while ATR rises from 2 to 4. A freshly calculated 3× ATR line falls from 98 to 92; a ratchet remains at 98.
The value table below is available without JavaScript.
Data and calculation details
Accessible value table (8 observations)
| Observation | Highest close and stop levels (price units) · Highest close | Highest close and stop levels (price units) · Highest close − 3 × current ATR | Highest close and stop levels (price units) · Ratchet | ATR (price units) · ATR |
|---|---|---|---|---|
| 1 | 100.000 | 94.000 | 94.000 | 2.000 |
| 2 | 102.000 | 96.000 | 96.000 | 2.000 |
| 3 | 104.000 | 98.000 | 98.000 | 2.000 |
| 4 | 104.000 | 95.000 | 98.000 | 3.000 |
| 5 | 104.000 | 92.000 | 98.000 | 4.000 |
| 6 | 105.000 | 96.000 | 98.000 | 3.000 |
| 7 | 105.000 | 99.000 | 99.000 | 2.000 |
| 8 | 105.000 | 97.500 | 99.000 | 2.500 |
In the constructed example, the highest close stays at 104 while ATR rises from 2 to 4. At a 3× multiple, the adaptive line falls from 98 to 92. The ratchet remains at 98.
Both formulas use ATR. They implement different exit policies. One continually adapts its distance; the other preserves the tightest level reached so far. A name such as “ATR trailing stop” is insufficient to tell them apart.
We tested four explicit exit formulas
All four rules use the same entry and can also exit when price crosses below the entry average. They differ only in the additional ATR exit line:
| Exit formula | Anchor | ATR distance |
|---|---|---|
| Fixed stop | Recorded entry price | ATR frozen at the entry signal |
| Fixed-distance trail | Higher of entry price and highest close | ATR frozen at the entry signal |
| Adaptive trail | Higher of entry price and highest close | Current ATR, recalculated each candle |
| Ratcheted adaptive trail | Higher of entry price and highest close | Current ATR, with the previous stop as a floor |
The tests compare close-triggered market exits. A close below the line requests an order for the following candle. They do not simulate an exchange stop order that guarantees an intrabar fill at the drawn level.
Tightening the formula changes exit timing; a higher multiplier is not automatically a better historical result.
The value table below is available without JavaScript.
Data and calculation details
Accessible value table (31 observations)
| Observation | Recorded strategy return (%) · Adaptive distance | Recorded strategy return (%) · Ratchet | Platform-reported maximum drawdown (%) · Adaptive distance | Platform-reported maximum drawdown (%) · Ratchet |
|---|---|---|---|---|
| 0.5 | -46.545 | -46.545 | 60.589 | 60.589 |
| 0.75 | -48.370 | -48.520 | 62.888 | 62.996 |
| 1.0 | -46.876 | -49.204 | 60.715 | 62.810 |
| 1.25 | -52.726 | -51.098 | 67.104 | 64.676 |
| 1.5 | -39.787 | -50.378 | 64.910 | 67.253 |
| 1.75 | -50.198 | -49.486 | 70.845 | 70.206 |
| 2.0 | -47.043 | -56.312 | 74.677 | 73.657 |
| 2.25 | -27.206 | -36.078 | 63.843 | 69.232 |
| 2.5 | -20.812 | -25.158 | 68.754 | 66.919 |
| 2.75 | -23.499 | -25.069 | 71.118 | 70.791 |
| 3.0 | -25.959 | -27.935 | 72.046 | 71.483 |
| 3.25 | -28.688 | -26.618 | 72.837 | 72.295 |
| 3.5 | -28.190 | -27.672 | 72.856 | 72.660 |
| 3.75 | -28.266 | -28.266 | 72.856 | 72.856 |
| 4.0 | -28.481 | -28.025 | 73.076 | 72.904 |
| 4.25 | -26.770 | -28.630 | 72.432 | 73.132 |
| 4.5 | -26.770 | -28.838 | 72.432 | 73.210 |
| 4.75 | -28.383 | -28.838 | 73.039 | 73.210 |
| 5.0 | -28.383 | -28.838 | 73.039 | 73.210 |
| 5.25 | -28.383 | -26.770 | 73.039 | 72.432 |
| 5.5 | -28.383 | -28.383 | 73.039 | 73.039 |
| 5.75 | -28.383 | -28.383 | 73.039 | 73.039 |
| 6.0 | -28.383 | -28.383 | 73.039 | 73.039 |
| 6.25 | -28.383 | -28.383 | 73.039 | 73.039 |
| 6.5 | -28.383 | -28.383 | 73.039 | 73.039 |
| 6.75 | -28.383 | -28.383 | 73.039 | 73.039 |
| 7.0 | -28.383 | -28.383 | 73.039 | 73.039 |
| 7.25 | -28.383 | -28.383 | 73.039 | 73.039 |
| 7.5 | -28.383 | -28.383 | 73.039 | 73.039 |
| 7.75 | -28.383 | -28.383 | 73.039 | 73.039 |
| 8.0 | -28.383 | -28.383 | 73.039 | 73.039 |
Across the matched adaptive-versus-ratchet comparisons, 99.5% recorded the same number of executions. Their returns still differed: the ratchet produced a higher historical return in 32.4% of pairs, a lower return in 18.0%, and the same reported return in 49.6%. These shares describe this defined grid; they do not give probabilities for a future trade.
The chart changes only the ATR multiple, keeping the volatility length and entry rule fixed. The return surface has irregular steps because moving an exit past one candle can change its execution price. A wider multiple does not guarantee a higher return, and a ratchet does not guarantee a lower realized drawdown in every historical setting.
Why earlier exits need not mean fewer transactions
Our entry requires a fresh upward crossing of the trend average. After an ATR exit, price must complete another qualifying crossing before a new position can start. The ordinary downward crossing also provides an exit if an ATR line has not already done so.
At the fixed ATR 14/3×/EMA 50 setting, all four formulas also recorded the same execution count within each of the eight small-amount sample comparisons. Under that structure, a stop can change when the same cycle ends without creating or removing the next entry opportunity. This differs from a rule that re-enters immediately whenever price remains above the average. The entry specification is part of the stop experiment.
These observations concern a defined long-only rule on historical candles. ATR itself supplies a distance scale; the entry, anchor, update, ratchet, order type, and quantity determine what that scale does inside a strategy.
Try the tested rule
Defaults use ATR 14, a 3× distance, and an EMA 50 entry. stopMode selects the four formulas in the table. The script requests 99% equity sizing and a 500-candle startup; configure fees and market dates separately.
//@version=6
strategy("ATR stop laboratory", overlay=true, initial_capital=10000, default_qty_type=strategy.percent_of_equity, default_qty_value=99, process_orders_on_close=false)
atrLength = input.int(14, "ATR length", minval=2)
multiple = input.float(3, "ATR multiple", minval=0.1)
trendLength = input.int(50, "Entry EMA length", minval=2)
stopMode = input.int(2, "Stop: 0 fixed, 1 fixed-distance trail, 2 adaptive, 3 ratchet", minval=0, maxval=3)
a = ta.atr(atrLength)
trend = ta.ema(close, trendLength)
up = ta.crossover(close, trend)
down = ta.crossunder(close, trend)
var float entryATR = na
var float highClose = na
var float ratchet = na
float stopLine = na
if strategy.position_size > 0
    highClose := na(highClose) ? math.max(strategy.position_avg_price, close) : math.max(highClose, close)
    fixedStop = strategy.position_avg_price - multiple * entryATR
    fixedTrail = highClose - multiple * entryATR
    adaptive = highClose - multiple * a
    ratchet := na(ratchet) ? adaptive : math.max(ratchet, adaptive)
    stopLine := stopMode == 0 ? fixedStop : stopMode == 1 ? fixedTrail : stopMode == 2 ? adaptive : ratchet
    if close < stopLine or down
        strategy.close("Long")
else
    highClose := na
    ratchet := na
    if bar_index >= 500 and up
        entryATR := a
        strategy.entry("Long", strategy.long)
plot(trend, title="Entry EMA", color=color.blue)
plot(stopLine, title="Close-tested stop", color=color.orange)
Study design, exact exit rules, and execution limits
The main grid uses ATR lengths 3, 5, 7, 10, 12, 14, 16, 18, 21, 25, 28, 35, 42, 50, 60, 70, 80, 90, 100, 125, 150; multiples 0.5–8 by 0.25; entry EMA lengths 20, 35, 50, 75, 100; and four stop modes. That gives 13,020 configurations per frame × eight frames = 104,160 evaluations. Nearby settings are related configurations rather than independent statistical trials.
The eight frames use Binance Spot BTCUSDT and ETHUSDT, 2h and 4h candles, and date windows 2021-01-01–2023-12-31 and 2024-01-01–2025-12-31, with UTC date endpoints. Date-only endpoints are candle-open boundaries: the final supplied candle opens at 00:00 UTC on the listed end date, rather than covering that entire calendar day. The earlier window guided exploration, followed by unchanged historical replications. Earlier projects had already exposed these date windows, so they are not blind holdouts or prospective tests.
Every main run starts with 10,000 USDT cash, requests 99% equity allocation, has no leverage or cash yield, and uses 0.1% combined fee/slippage per execution. That request does not guarantee a persistent 1% cash reserve under the recorded fill model. The first 500 candles are startup inside the selected window; this reduces initialization effects without proving exact convergence at every ATR length. The two candle sizes imply different elapsed startup time.
Entry is a close crossing above its EMA while flat. ATR at that signal is stored for modes 0 and 1. The highest-close anchor starts with the larger of the recorded entry price and the first held candle’s close, then retains its maximum. Modes 2 and 3 use the latest ATR; mode 3 also keeps the previous stop as a floor. A close below the selected line or an EMA crossunder requests a market exit on the next candle. Exact equality does not trigger the ATR exit. These are not intrabar protective stop orders, and a gap can put the execution beyond the line.
The chart of multiples shows ATR 14, entry EMA 50, and modes 2 and 3 from the earlier BTCUSDT 2h frame. The evidence download preserves the same selected curve and representative rows in all eight frames. One execution means one buy or one sell, not a closed round trip.
A separate 32-evaluation control repeats ATR 14/3×/EMA 50 in all four modes across all eight frames, requesting quantity 100 / signal close. This reduces funding failures and changes exposure; its returns should not be compared directly with the main allocation’s returns. A detailed adaptive trace from the later BTCUSDT 4h frame retains full recorded trades and exact candles. The ratcheted comparisons use the completed aggregate sweeps. Controls and diagnostics are excluded from the 104,160 main count.
Results came from TrainBard’s MCP and web interface. Every original export was preserved and checked against its exact requested Cartesian grid. Browser exports were also reconciled with the visible completion, zero-trade, error, cost and date settings. A separate four-row interface check matched every common numeric metric exactly and is excluded from the main count. Failed or duplicate tuples were not accepted. The platform’s aggregate drawdown field is reported as supplied, without an independently reconstructed intrabar equity path. Batch metrics carry slightly less numerical precision than detailed runs. Per-trade fee fields are not simply additive: a closing record can include the entry/exit pair, so aggregate fees and cash arithmetic are checked separately.
The compact study evidence preserves all frame definitions, run identifiers, source checksums, paired comparisons, selected rows, and multiplier curves. The shared execution and source audit records exact startup-matched passive comparisons and the independent fill, fee, and candle checks. Some returned historical candles differ slightly from exchange monthly archives; the exact candles supplied to the run remain the execution reference. A platform full-window buy-and-hold summary begins before strategy startup, so it is not a matched investment comparison.
The stop arithmetic chart uses constructed values, explicitly labeled. It demonstrates the update rule; it does not represent a market episode or imply that either line was an executable historical fill. Results remain specific to these markets, samples, costs, and rules, and do not establish live-trading performance.
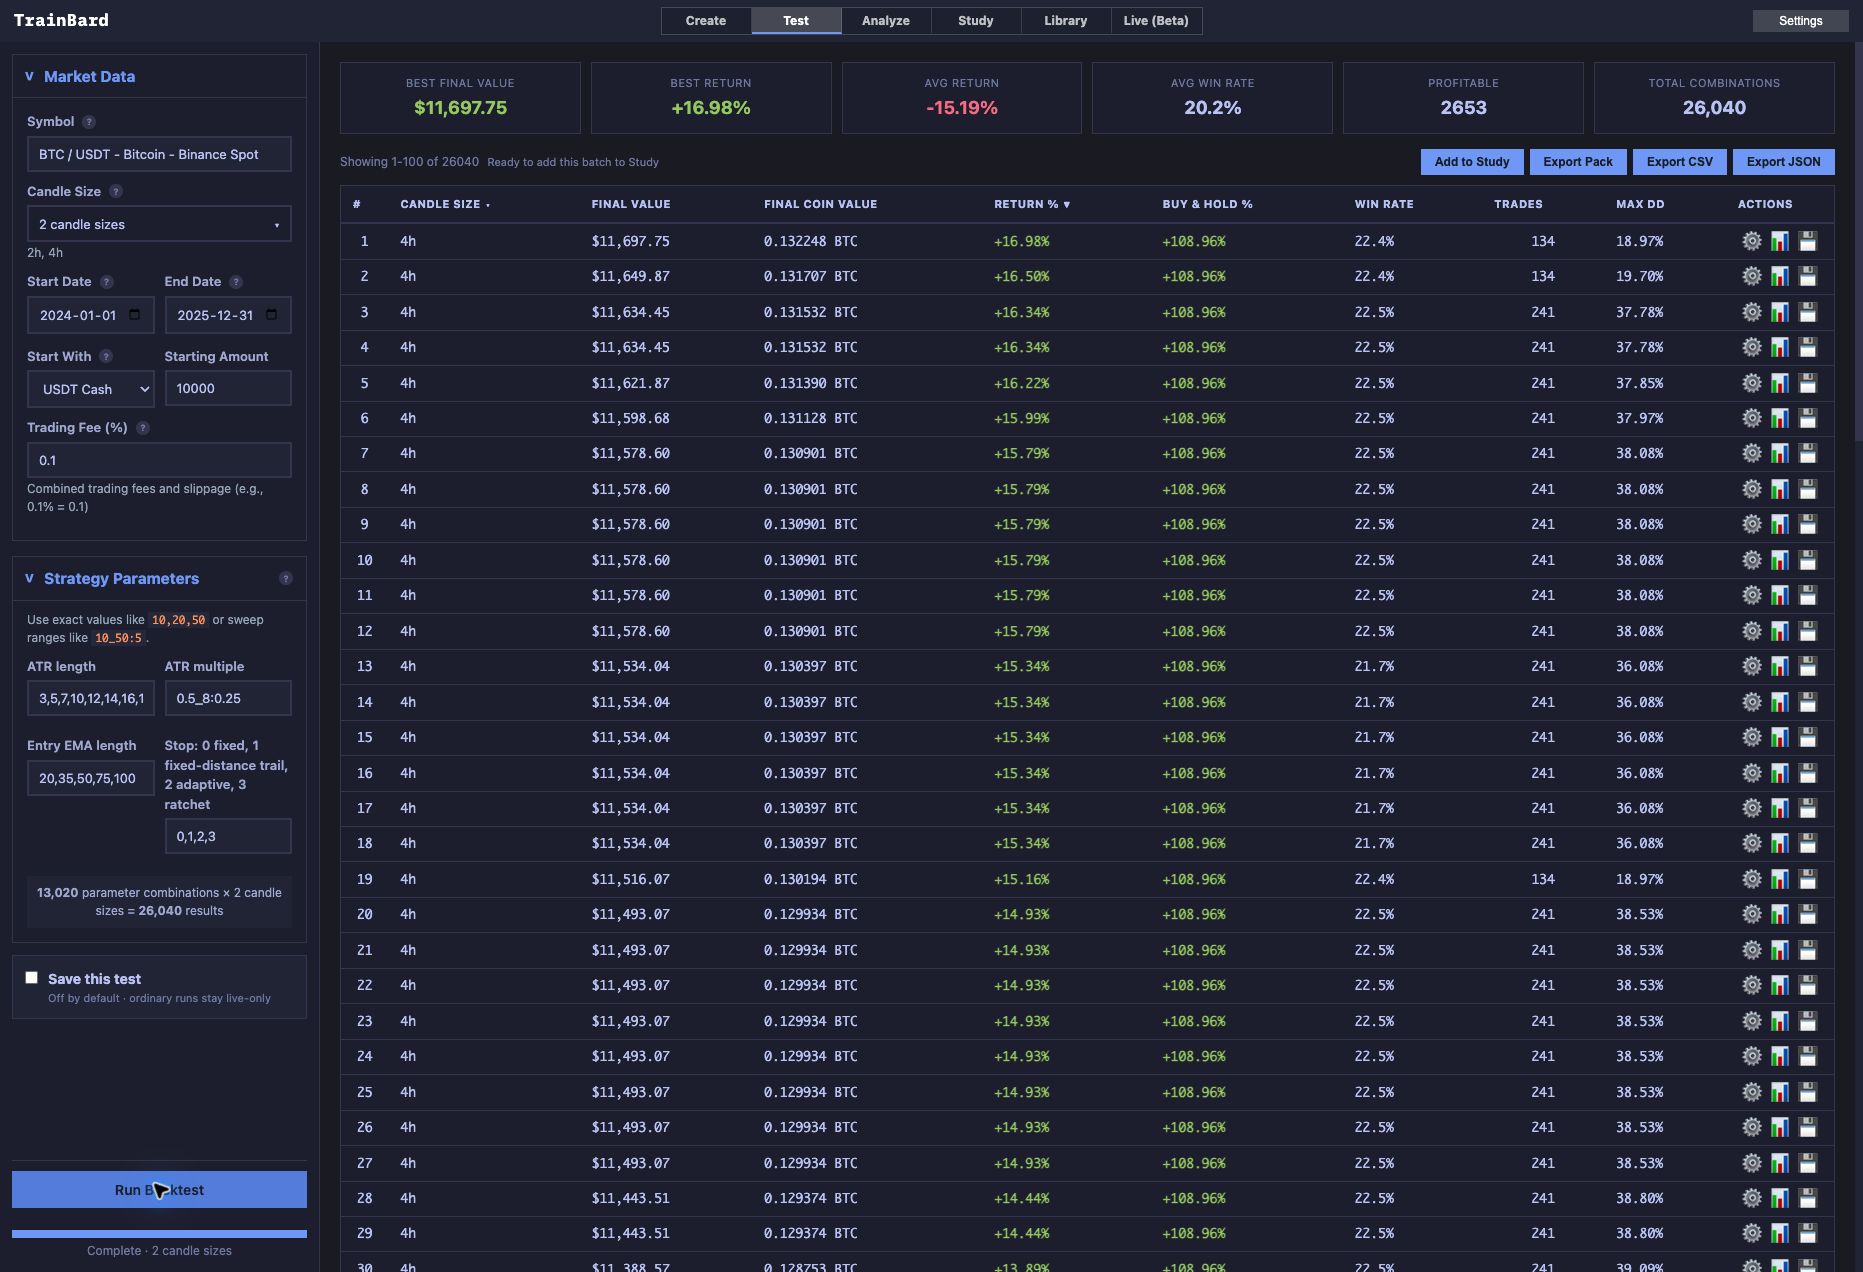
Original TrainBard completion for 26,040 ATR settings on the later BTCUSDT two- and four-hour frames. The displayed best row is completion evidence, not a recommended setting.