Key takeaways
- ADX measures smoothed directional imbalance; a rising ADX can accompany a falling price. Positive and negative DI supply direction.
- In controlled tests, longer ADX smoothing could increase threshold-only activity while reducing activity under a rising-ADX entry gate.
- Requiring a rising ADX changes which entries qualify. It does not guarantee that the remaining historical trades earn a higher return.
The Average Directional Index, or ADX, measures trend strength. The accompanying +DI and −DI lines help identify direction. A rising ADX can therefore accompany a strong decline as well as a strong advance.
Across 99,456 configuration evaluations, we varied the directional lookback, the smoothing of ADX, and the strength required for an entry. We also tested a familiar extra condition: require ADX to be rising. The distinction between the height of ADX and its slope changed which trades qualified.
What does ADX show?
ADX belongs to Welles Wilder’s Directional Movement system. Positive directional movement tracks an upward extension of the high; negative directional movement tracks a downward extension of the low. The calculation compares those changes and retains the dominant positive movement on each candle.
After smoothing and scaling by true range, they become +DI and −DI. When +DI is above −DI, upward directional movement dominates this measure. When −DI is above +DI, downward movement dominates.
ADX takes the size of their relative difference and smooths it again. Fidelity’s DMI reference describes the calculation and the distinction between trend direction and strength.
The ADX formula, step by step
The full calculation has two layers of smoothing:
Up move   = current high − previous high
Down move = previous low − current low

+DM = up move if it is positive and greater than the down move; otherwise 0
−DM = down move if it is positive and greater than the up move; otherwise 0

+DI = 100 × Wilder-smoothed +DM / Wilder-smoothed true range
−DI = 100 × Wilder-smoothed −DM / Wilder-smoothed true range

DX  = 100 × abs(+DI − −DI) / (+DI + −DI)
ADX = Wilder-smoothed DX
True range is the greatest of the candle’s high-low range, its high’s distance from the preceding close, and its low’s distance from that close. The displayed ratio needs a nonzero denominator.
Wilder smoothing updates an existing average by adding one nth of the difference between the new observation and that average. With length 14, each new observation has weight 1/14. Initialization also matters near the start of a chart. StockCharts documents Wilder’s smoothing and the calculation sequence.
If +DI is 30 and −DI is 10, DX is 50. Swap those two values and DX is still 50. The direction changed; the unsigned imbalance did not. That is why ADX alone cannot distinguish bullish from bearish movement.
Common ADX settings and signals
14 is a common directional lookback and smoothing length, often displayed as 14/14. These are two settings: one changes the DI inputs, while the other changes how the resulting DX observations become ADX.
Readings above 25 are commonly treated as stronger-trend conditions, and readings below 20 as weaker or less directional conditions. The area between them is not a guaranteed transition zone. These are conventions, rather than universal boundaries separating good and bad trades. Fidelity’s ADX guide discusses the familiar interpretation.
A DI crossover supplies direction. An ADX threshold can qualify its strength. A rising-ADX condition asks whether the smoothed strength reading has increased from the preceding candle. The three tests can disagree.
For example, +DI may be above −DI while ADX is falling from a high value. That still describes positive directional dominance with a weakening strength reading. It does not automatically mean the price is falling.
Why a rising ADX can accompany a falling market
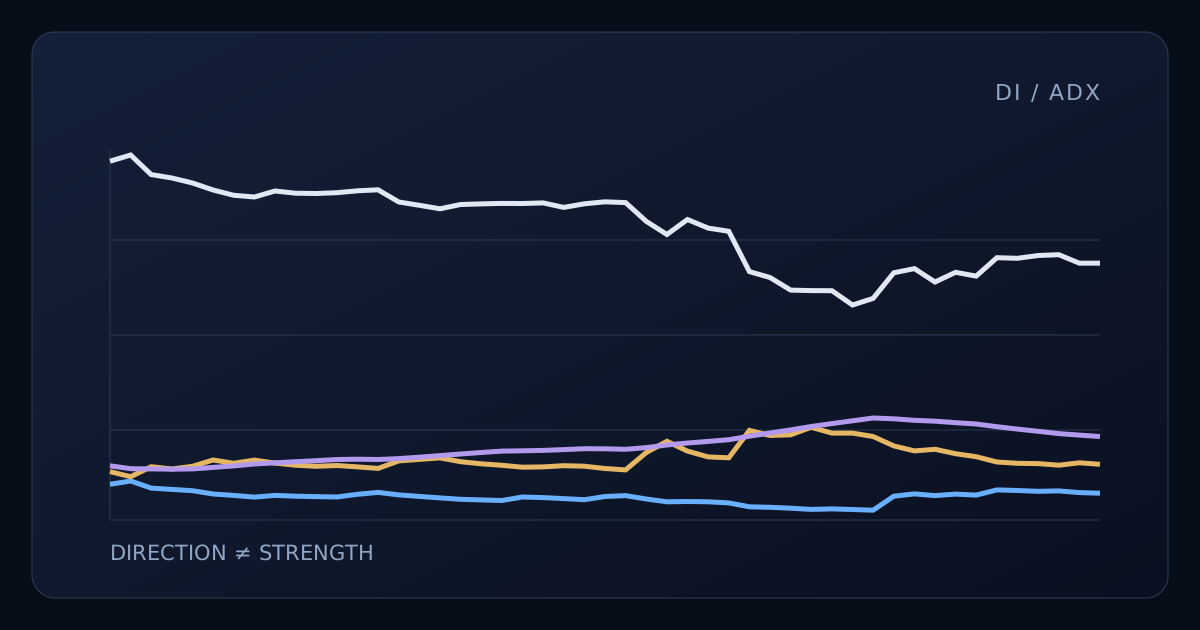
A falling price can accompany a rising ADX. Direction comes from the DI lines; ADX smooths their imbalance.
The value table below is available without JavaScript.
Data and calculation details
Accessible value table (49 observations)
| Observation | Closing price · Close | DMI 14 / ADX 14 · Positive DI | DMI 14 / ADX 14 · Negative DI | DMI 14 / ADX 14 · ADX |
|---|---|---|---|---|
| 2024-08-02T10:00:00Z | 64,660.010 | 20.455 | 28.956 | 32.789 |
| 2024-08-02T12:00:00Z | 65,229.990 | 22.650 | 25.554 | 30.877 |
| 2024-08-02T14:00:00Z | 63,416.010 | 17.918 | 32.222 | 30.709 |
| 2024-08-02T16:00:00Z | 63,098.010 | 17.071 | 30.699 | 30.553 |
| 2024-08-02T18:00:00Z | 62,633.570 | 16.174 | 32.436 | 30.760 |
| 2024-08-02T20:00:00Z | 61,987.010 | 14.032 | 36.699 | 31.754 |
| 2024-08-02T22:00:00Z | 61,498.330 | 13.035 | 34.484 | 32.710 |
| 2024-08-03T00:00:00Z | 61,342.010 | 11.941 | 36.574 | 34.001 |
| 2024-08-03T02:00:00Z | 61,895.990 | 13.054 | 34.633 | 34.804 |
| 2024-08-03T04:00:00Z | 61,693.990 | 12.550 | 33.172 | 35.540 |
| 2024-08-03T06:00:00Z | 61,662.010 | 12.275 | 32.445 | 36.223 |
| 2024-08-03T08:00:00Z | 61,735.990 | 11.989 | 32.977 | 36.970 |
| 2024-08-03T10:00:00Z | 61,919.380 | 13.777 | 32.052 | 37.177 |
| 2024-08-03T12:00:00Z | 62,007.990 | 15.064 | 31.060 | 36.999 |
| 2024-08-03T14:00:00Z | 60,879.000 | 13.375 | 36.039 | 37.632 |
| 2024-08-03T16:00:00Z | 60,576.000 | 12.371 | 37.053 | 38.511 |
| 2024-08-03T18:00:00Z | 60,246.000 | 11.427 | 38.099 | 39.607 |
| 2024-08-03T20:00:00Z | 60,648.000 | 10.491 | 35.550 | 40.666 |
| 2024-08-03T22:00:00Z | 60,697.990 | 10.082 | 34.164 | 41.649 |
| 2024-08-04T00:00:00Z | 60,743.580 | 9.646 | 33.131 | 42.595 |
| 2024-08-04T02:00:00Z | 60,735.000 | 12.022 | 31.855 | 42.782 |
| 2024-08-04T04:00:00Z | 60,792.000 | 11.575 | 32.074 | 43.080 |
| 2024-08-04T06:00:00Z | 60,373.990 | 10.901 | 32.896 | 43.590 |
| 2024-08-04T08:00:00Z | 60,708.000 | 10.212 | 32.530 | 44.207 |
| 2024-08-04T10:00:00Z | 60,896.000 | 12.301 | 31.019 | 44.135 |
| 2024-08-04T12:00:00Z | 60,822.010 | 12.929 | 30.069 | 43.830 |
| 2024-08-04T14:00:00Z | 59,086.010 | 10.664 | 41.626 | 44.929 |
| 2024-08-04T16:00:00Z | 57,864.430 | 8.771 | 49.117 | 46.698 |
| 2024-08-04T18:00:00Z | 59,257.660 | 8.992 | 42.618 | 48.016 |
| 2024-08-04T20:00:00Z | 58,459.980 | 8.811 | 38.747 | 49.083 |
| 2024-08-04T22:00:00Z | 58,161.000 | 8.081 | 38.138 | 50.222 |
| 2024-08-05T00:00:00Z | 54,432.650 | 5.485 | 56.388 | 52.511 |
| 2024-08-05T02:00:00Z | 53,890.870 | 5.153 | 52.970 | 54.637 |
| 2024-08-05T04:00:00Z | 52,718.000 | 4.549 | 53.454 | 56.757 |
| 2024-08-05T06:00:00Z | 52,674.190 | 3.709 | 58.490 | 58.994 |
| 2024-08-05T08:00:00Z | 52,667.800 | 4.052 | 54.590 | 60.935 |
| 2024-08-05T10:00:00Z | 51,340.000 | 3.686 | 54.617 | 62.823 |
| 2024-08-05T12:00:00Z | 51,951.000 | 3.224 | 52.341 | 64.649 |
| 2024-08-05T14:00:00Z | 54,321.090 | 12.545 | 46.048 | 64.116 |
| 2024-08-05T16:00:00Z | 54,707.990 | 14.092 | 42.703 | 63.134 |
| 2024-08-05T18:00:00Z | 53,470.090 | 12.901 | 43.833 | 62.519 |
| 2024-08-05T20:00:00Z | 54,372.010 | 13.915 | 40.845 | 61.566 |
| 2024-08-05T22:00:00Z | 54,018.810 | 13.241 | 38.866 | 60.681 |
| 2024-08-06T00:00:00Z | 55,723.980 | 16.725 | 35.311 | 58.898 |
| 2024-08-06T02:00:00Z | 55,665.730 | 16.316 | 34.447 | 57.242 |
| 2024-08-06T04:00:00Z | 55,925.970 | 15.793 | 34.275 | 55.790 |
| 2024-08-06T06:00:00Z | 55,999.990 | 16.054 | 33.180 | 54.290 |
| 2024-08-06T08:00:00Z | 55,211.990 | 14.954 | 34.770 | 53.259 |
| 2024-08-06T10:00:00Z | 55,210.010 | 14.550 | 33.831 | 52.301 |
Between the two marked observations, the close falls 17.09% while ADX rises from 37.18 to 62.82. The negative DI line dominates at the later observation. This selected historical episode makes the direction/strength distinction visible.
The indicator is doing its stated job. A growing imbalance in favor of −DI can raise ADX. Treating every upward ADX slope as a buy signal discards the part of the display that tells you the direction.
The chart contains locally calculated indicator values from recorded candles. It shows no trading fills and makes no claim about what happens after the selected decline.
What happens when ADX smoothing changes?
We used a deliberately simple long-only rule: enter when +DI is above −DI and ADX meets a chosen threshold; exit when −DI becomes larger. A second version also required ADX to be higher than its preceding reading at entry.
Directional lookback 14 and strength threshold 25 stay fixed. Change only ADX smoothing; the two entry conditions respond differently.
The value table below is available without JavaScript.
Data and calculation details
Accessible value table (24 observations)
| Observation | Executed entries and exits · ADX above 25 | Executed entries and exits · ADX above 25 and rising |
|---|---|---|
| 2 | 352.000 | 344.000 |
| 3 | 336.000 | 318.000 |
| 4 | 338.000 | 298.000 |
| 5 | 332.000 | 284.000 |
| 6 | 342.000 | 270.000 |
| 7 | 352.000 | 264.000 |
| 8 | 364.000 | 258.000 |
| 9 | 370.000 | 248.000 |
| 10 | 370.000 | 246.000 |
| 11 | 378.000 | 238.000 |
| 12 | 388.000 | 236.000 |
| 13 | 394.000 | 230.000 |
| 14 | 394.000 | 232.000 |
| 15 | 406.000 | 232.000 |
| 16 | 414.000 | 234.000 |
| 17 | 420.000 | 232.000 |
| 18 | 428.000 | 228.000 |
| 19 | 432.000 | 226.000 |
| 20 | 438.000 | 224.000 |
| 21 | 438.000 | 224.000 |
| 22 | 446.000 | 224.000 |
| 23 | 454.000 | 224.000 |
| 24 | 458.000 | 228.000 |
| 25 | 464.000 | 228.000 |
In the displayed control, extending ADX smoothing from 2 to 14 to 25 changed threshold-only executions from 352 to 394 to 464. With the rising condition added, the same settings gave 344 to 232 to 228. The longer smoothing made one version busier and the other quieter. Increasing smoothing from 2 to 25 raised threshold-only activity and reduced rising-gated activity in all eight samples. Exact replications remain in the evidence.
More smoothing changes the path by which ADX approaches and leaves a threshold. It can preserve an old strength reading longer as well as delay a new increase. Counting eligible trades therefore requires the whole rule and price history; the word “slower” does not determine the count. Strength persisting through a change of direction is an established ADX behavior, also illustrated in the StockCharts reference. These experiments measure how that memory interacts with the two specified entry conditions.
The rising condition also has a specific role in this experiment. It qualifies an entry, while the exit still depends on the DI lines. It does not exit a trade merely because ADX begins falling. An alternative that exits on falling ADX would be a different strategy.
Does requiring a rising ADX improve the rule?
The matched main-study comparisons include both higher and lower historical returns after adding the rising condition. A stronger entry requirement was not a universal improvement. One recorded entry in a separate control with DI length 14 and ADX smoothing 25 qualified with ADX 33.11, above 25 but down from 34.39, after recent negative-DI dominance. A high strength reading can persist as direction changes; requiring a positive slope asks an additional question. The selected fill and indicator check remain in the evidence.
A filter can remove early entries, postpone others within the same directional episode, and skip an episode entirely. Those changes affect both participation and risk. A better-looking top row does not tell us that the filter improved the surrounding settings.
For a practical comparison, keep DI length and the strength threshold fixed, compare both entry conditions, and then inspect nearby smoothing lengths. Check total return and drawdown alongside activity. ADX describes recent directional movement; it does not guarantee that the next move continues it.
Reproduce the comparison
The script exposes the directional lookback, ADX smoothing, threshold, and optional rising condition. It implements this limited DMI/ADX adaptation rather than Wilder’s complete trading method.
//@version=6
strategy("ADX directional strength research", overlay=false, initial_capital=10000, default_qty_type=strategy.percent_of_equity, default_qty_value=99, process_orders_on_close=false)
di_length = input.int(14, "Directional length", minval=2)
adx_smoothing = input.int(14, "ADX smoothing", minval=2)
threshold = input.int(25, "ADX threshold", minval=1)
require_rising = input.int(0, "Require rising ADX", minval=0, maxval=1)
[plus_di, minus_di, adx] = ta.dmi(di_length, adx_smoothing)
ready = bar_index >= 500
enter = plus_di > minus_di and adx >= threshold and (require_rising == 0 or adx > adx[1])
leave = plus_di < minus_di
if ready and strategy.position_size == 0 and enter
    strategy.entry("Long", strategy.long)
if ready and strategy.position_size > 0 and leave
    strategy.close("Long")
plot(plus_di, title="Positive DI", color=color.aqua)
plot(minus_di, title="Negative DI", color=color.orange)
plot(adx, title="ADX", color=color.purple)
hline(25, title="Common trend threshold")
Settings, accounting, and reproducibility
The main study contains 99,456 accepted valid evaluations across Binance Spot BTCUSDT and ETHUSDT, two- and four-hour candles, and the date inputs 2021-01-01–2023-12-31 and 2024-01-01–2025-12-31. Every dataset uses the same grid: directional lengths 4–40; ADX smoothing lengths 2–25; thresholds 10, 15, 20, 25, 30, 35, or 40; and both entry-gate choices. That is 12,432 settings per dataset. The 49,728 paired rising-gate comparisons share every other parameter. These are related retrospective evaluations, not independent statistical trials or blind holdouts.
Every main evaluation started with 10,000 USDT and remained in cash for the first 500 bars. It was long-only with no leverage, no yield on idle cash, and a requested combined fee/slippage of 0.1% per execution. The scripts request 99% equity sizing, evaluate completed-candle conditions and use next-open market orders. This requested percentage does not guarantee a persistent 1% cash reserve across repeated trades. Sizing and costs can change which later signals become recorded executions. Recorded results follow the platform’s fee and fill model; small fixed-quote controls test the activity comparisons separately. A remaining position is valued at the last close.
A selected end date includes the candle opening at 00:00 UTC on that date, rather than the entire final calendar day. Five hundred startup bars cover different elapsed time on two- and four-hour charts. The platform’s first-close to last-close holding return includes that startup and excludes trading costs. Separate recorded passive controls match startup, requested size and entry cost; the shared audit preserves them. Positive strategy return is not the same as beating either holding comparator.
Historical comparisons use the candles returned by TrainBard. An independent check against checksum-verified official monthly archives found exact agreement in the later window and small earlier-window differences, preserved in the shared source audit. Public historical indicator examples use the verified later window. No locally reconstructed trading simulation supplies any performance result.
Accepted evidence combines the completed MCP frames with the remaining frames completed through TrainBard’s web interface. Original web exports, completed count displays, screenshots and exact source checksums remain in the archive. Every missing web-export tuple must reconcile with the completed zero-execution count. Such tuples supply an execution count of zero for activity comparisons; no absent return, drawdown, win-rate or fee value is invented. Return comparisons use pairs for which both portfolio metrics were actually returned.
The main tables contain 99,456 rows with executions and 0 zero-execution configurations. Original result membership, exact parameter grids, unique tuples, capital, fees, finite metrics and completion counts were verified. Four executable diagnostic settings and 384 fixed-quote activity-control settings are excluded from the main count. Controls fix DI length 14 and threshold 25 while changing ADX smoothing and the rising gate. An explicit quantity of 100 divided by the signal close supplies a small quote budget; next-open prices can make the actual entry value slightly different.
The activity data retain every control dataset; the visible panel selects a representative comparison and uses a zero-based execution axis. A buy and a sell are two executions. A condition seen while already holding does not add another long entry. Published return comparisons are recorded main-study metrics under the requested sizing model; they are not a signal-only counterfactual.
The historical chart recalculates DI14/ADX14 with Wilder averages seeded from fourteen nonmissing observations, using checksum-verified official BTCUSDT two-hour candles from 2024–2025. It selects a 24-bar decline with ADX gaining at least 15 points and terminal −DI dominance, then shows surrounding context. This selection explains the calculation; it does not estimate how often the pattern occurs. No local trading simulation supplies any result.
Download the tested script, fixed-quote control script, accepted study evidence, historical-chart provenance, and shared execution and candle audit. Exact sanitized requests, original responses, complete sweep tables and hashes remain in the research archive.
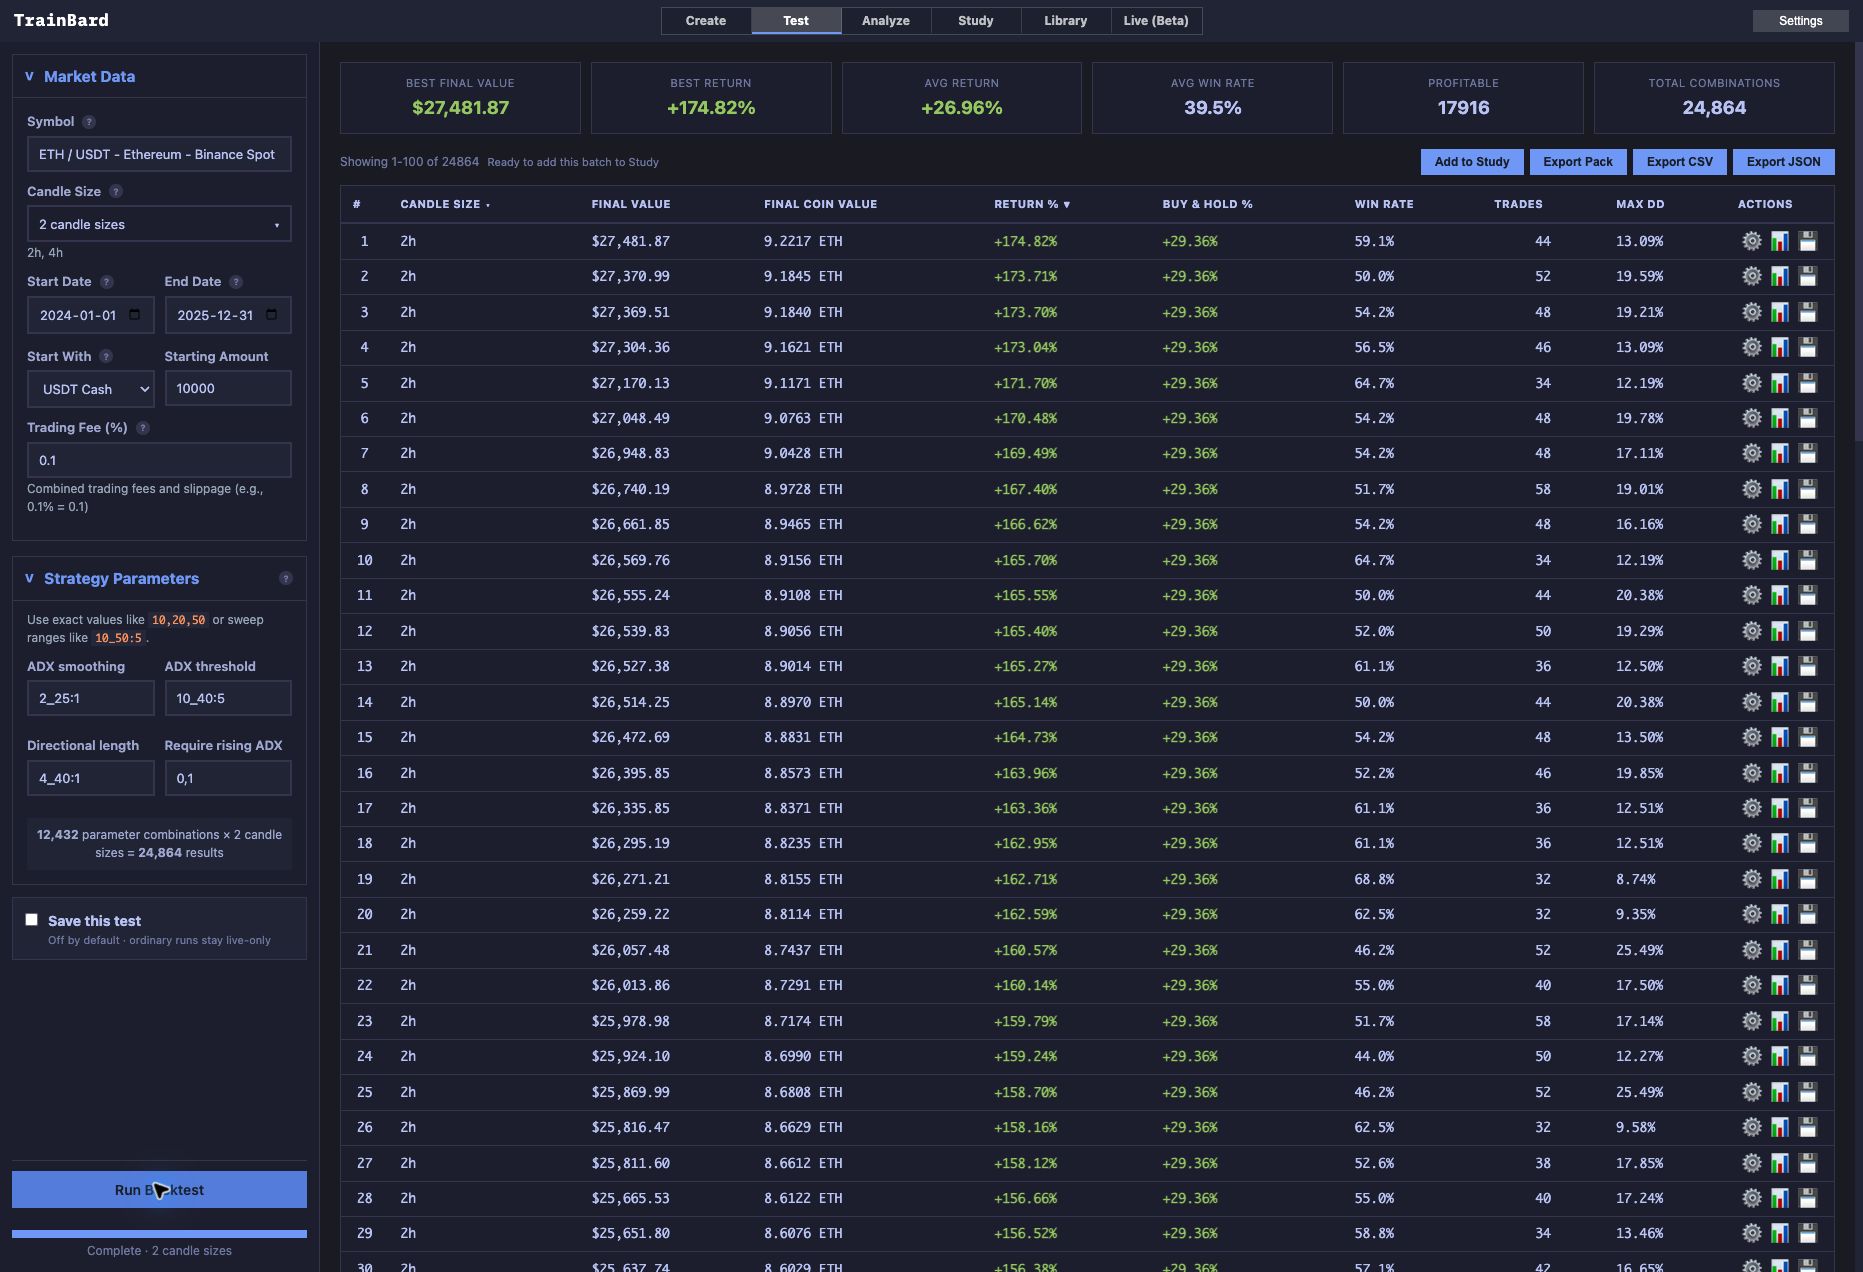
This original UI completion covers 24,864 settings on the later ETHUSDT two- and four-hour frames. It is one component of the full study; the best displayed row is not a recommended setting.
For another view of smoothing and triggers, see the MACD guide. For a direct measure of movement size, see the ATR guide.