Key takeaways
- Bill Williams' Alligator combines three smoothed midpoint averages with different display shifts; the familiar lengths are 5, 8, and 13.
- A forward display shift changes which already-known value sits beside the current candle. It supplies no future prices.
- A five-bar fractal is known after two following candles close; requiring a fresh crossing also changes when the strategy can reenter.
- Displacement and confirmation changed historical returns, but their performance ranking depended on the sample and the exit rule.
The Alligator trading strategy uses three smoothed averages to distinguish an emerging trend from tangled, directionless movement. Bill Williams named the lines the lips, teeth, and jaw: traders wait for the mouth to open, then look for price to keep moving in that direction.
That picture leaves several decisions unresolved. Which values belong beside the current candle? Should a bullish alignment be enough, or should price also break a confirmed fractal high? What closes the position? Our completed 172,800 configuration evaluations separate those choices instead of assuming that one familiar chart defines one strategy.
What is Bill Williams’ Alligator indicator?
The Alligator is a trend-following indicator built from smoothed moving averages of the candle midpoint: (high + low) / 2. MetaTrader’s official Alligator guide gives the standard construction:
| Line | Smoothing length | Forward display shift |
|---|---|---|
| Lips, green | 5 candles | 3 candles |
| Teeth, red | 8 candles | 5 candles |
| Jaw, blue | 13 candles | 8 candles |
A smoothed moving average, or SMMA, starts with a simple average. Each subsequent value keeps (N−1)/N of the previous average and adds 1/N of the new midpoint. It has a longer memory than a simple average with the same stated length. The official moving-average calculation documents the smoothing formula.
These settings describe the indicator. They do not specify position sizing, stop placement, entry timing, or whether to take a second entry after an exit.
How to read Alligator signals
The familiar interpretations are:
- Sleeping: the lines are close together or repeatedly crossing. Direction is unclear.
- Waking up: the lines separate. Bullish order places lips above teeth above jaw; bearish order reverses it.
- Eating: the ordered lines continue to separate while price follows the trend.
- Closing: the lines converge or cross again, suggesting the trend has weakened.
These descriptions help organize a chart. Turning them into a strategy requires explicit conditions. “Close together,” for example, needs a measurable threshold before it can become a repeatable entry filter. The mouth can also open after much of a move has already happened.
Williams’ broader approach uses several tools. Our tests isolate two core long-entry rules, an above-level control, and two exits around the Alligator; they do not reproduce the complete Profitunity system.
Does the forward shift predict future prices?
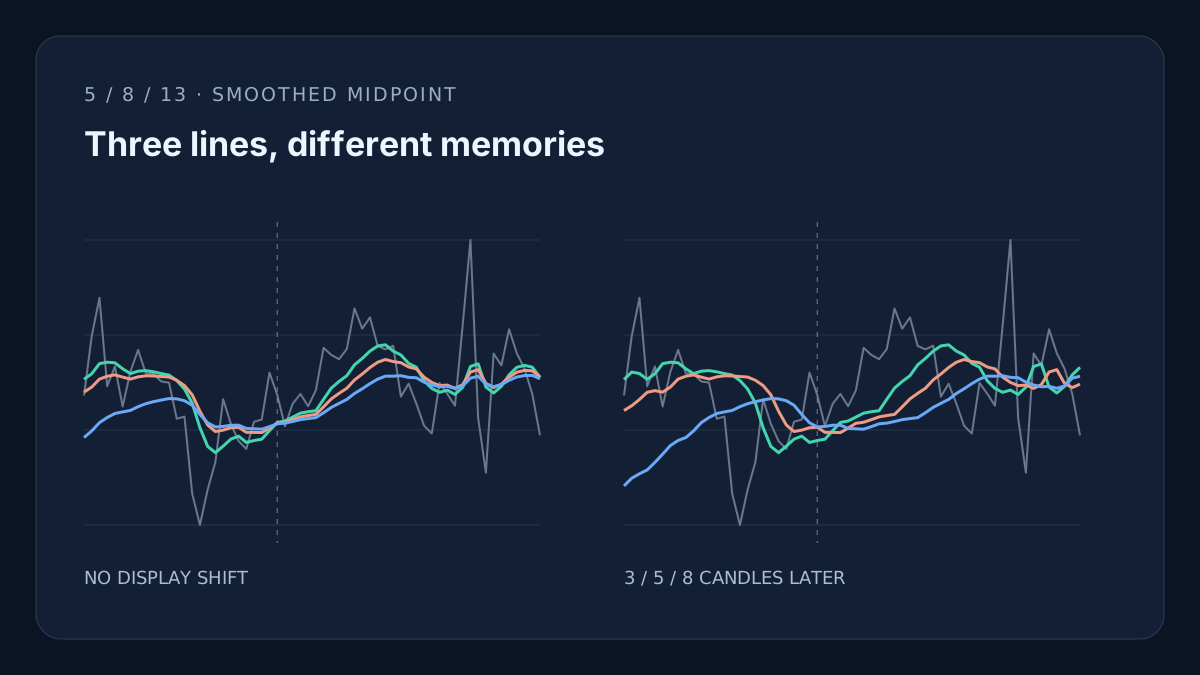
The shift moves the drawing to the right. It does not calculate tomorrow’s price. A five-candle average drawn three candles forward places an average calculated three candles ago beside the current candle.
That distinction changes the signal. Comparing the latest unshifted values and comparing the values actually drawn beside the latest candle are two different calculations. Both can use only information already available, yet their line order can disagree.
The same closing prices and 5/8/13 smoothing with and without 3/5/8-bar displacement. Displayed line order can differ because the lines sample different past bars.
The value table below is available without JavaScript.
Data and calculation details
Accessible value table (60 observations)
| Observation | Unshifted smoothing values · Close | Unshifted smoothing values · Lips · 5 | Unshifted smoothing values · Teeth · 8 | Unshifted smoothing values · Jaw · 13 | Lines at the current chart coordinate · Close | Lines at the current chart coordinate · Lips · 5 | Lines at the current chart coordinate · Teeth · 8 | Lines at the current chart coordinate · Jaw · 13 |
|---|---|---|---|---|---|---|---|---|
| 2024-02-16T08:00:00Z | 100.000 | 100.203 | 100.042 | 99.471 | 100.000 | 100.199 | 99.810 | 98.864 |
| 2024-02-16T10:00:00Z | 100.745 | 100.272 | 100.105 | 99.555 | 100.745 | 100.294 | 99.871 | 98.961 |
| 2024-02-16T12:00:00Z | 101.227 | 100.400 | 100.206 | 99.659 | 101.227 | 100.275 | 99.950 | 99.016 |
| 2024-02-16T14:00:00Z | 100.116 | 100.418 | 100.241 | 99.723 | 100.116 | 100.203 | 100.040 | 99.065 |
| 2024-02-16T16:00:00Z | 100.364 | 100.410 | 100.258 | 99.773 | 100.364 | 100.272 | 100.060 | 99.159 |
| 2024-02-16T18:00:00Z | 99.862 | 100.335 | 100.231 | 99.793 | 99.862 | 100.400 | 100.042 | 99.262 |
| 2024-02-16T20:00:00Z | 100.297 | 100.275 | 100.206 | 99.812 | 100.297 | 100.418 | 100.105 | 99.371 |
| 2024-02-16T22:00:00Z | 100.571 | 100.305 | 100.234 | 99.859 | 100.571 | 100.410 | 100.206 | 99.435 |
| 2024-02-17T00:00:00Z | 100.277 | 100.312 | 100.247 | 99.896 | 100.277 | 100.335 | 100.241 | 99.471 |
| 2024-02-17T02:00:00Z | 100.272 | 100.297 | 100.245 | 99.922 | 100.272 | 100.275 | 100.258 | 99.555 |
| 2024-02-17T04:00:00Z | 100.176 | 100.275 | 100.238 | 99.943 | 100.176 | 100.305 | 100.231 | 99.659 |
| 2024-02-17T06:00:00Z | 100.161 | 100.256 | 100.231 | 99.961 | 100.161 | 100.312 | 100.206 | 99.723 |
| 2024-02-17T08:00:00Z | 99.708 | 100.187 | 100.191 | 99.957 | 99.708 | 100.297 | 100.234 | 99.773 |
| 2024-02-17T10:00:00Z | 99.735 | 100.081 | 100.124 | 99.934 | 99.735 | 100.275 | 100.247 | 99.793 |
| 2024-02-17T12:00:00Z | 98.767 | 99.904 | 100.008 | 99.877 | 98.767 | 100.256 | 100.245 | 99.812 |
| 2024-02-17T14:00:00Z | 98.373 | 99.595 | 99.802 | 99.760 | 98.373 | 100.187 | 100.238 | 99.859 |
| 2024-02-17T16:00:00Z | 98.818 | 99.359 | 99.629 | 99.657 | 98.818 | 100.081 | 100.231 | 99.896 |
| 2024-02-17T18:00:00Z | 99.163 | 99.282 | 99.547 | 99.604 | 99.163 | 99.904 | 100.191 | 99.922 |
| 2024-02-17T20:00:00Z | 99.953 | 99.363 | 99.564 | 99.611 | 99.953 | 99.595 | 100.124 | 99.943 |
| 2024-02-17T22:00:00Z | 99.642 | 99.452 | 99.595 | 99.626 | 99.642 | 99.359 | 100.008 | 99.961 |
| 2024-02-18T00:00:00Z | 99.427 | 99.489 | 99.600 | 99.627 | 99.427 | 99.282 | 99.802 | 99.957 |
| 2024-02-18T02:00:00Z | 99.329 | 99.410 | 99.537 | 99.586 | 99.329 | 99.363 | 99.629 | 99.934 |
| 2024-02-18T04:00:00Z | 99.670 | 99.434 | 99.536 | 99.581 | 99.670 | 99.452 | 99.547 | 99.877 |
| 2024-02-18T06:00:00Z | 99.697 | 99.450 | 99.533 | 99.576 | 99.697 | 99.489 | 99.564 | 99.760 |
| 2024-02-18T08:00:00Z | 100.287 | 99.558 | 99.590 | 99.608 | 100.287 | 99.410 | 99.595 | 99.657 |
| 2024-02-18T10:00:00Z | 100.008 | 99.661 | 99.650 | 99.644 | 100.008 | 99.434 | 99.600 | 99.604 |
| 2024-02-18T12:00:00Z | 99.615 | 99.679 | 99.663 | 99.652 | 99.615 | 99.450 | 99.537 | 99.611 |
| 2024-02-18T14:00:00Z | 99.896 | 99.728 | 99.696 | 99.673 | 99.896 | 99.558 | 99.536 | 99.626 |
| 2024-02-18T16:00:00Z | 100.019 | 99.777 | 99.731 | 99.696 | 100.019 | 99.661 | 99.533 | 99.627 |
| 2024-02-18T18:00:00Z | 99.865 | 99.796 | 99.748 | 99.710 | 99.865 | 99.679 | 99.590 | 99.586 |
| 2024-02-18T20:00:00Z | 100.064 | 99.808 | 99.762 | 99.721 | 100.064 | 99.728 | 99.650 | 99.581 |
| 2024-02-18T22:00:00Z | 100.598 | 99.952 | 99.857 | 99.783 | 100.598 | 99.777 | 99.663 | 99.576 |
| 2024-02-19T00:00:00Z | 100.510 | 100.092 | 99.957 | 99.850 | 100.510 | 99.796 | 99.696 | 99.608 |
| 2024-02-19T02:00:00Z | 100.455 | 100.176 | 100.026 | 99.901 | 100.455 | 99.808 | 99.731 | 99.644 |
| 2024-02-19T04:00:00Z | 100.584 | 100.248 | 100.090 | 99.950 | 100.584 | 99.952 | 99.748 | 99.652 |
| 2024-02-19T06:00:00Z | 101.092 | 100.384 | 100.195 | 100.025 | 101.092 | 100.092 | 99.762 | 99.673 |
| 2024-02-19T08:00:00Z | 100.839 | 100.465 | 100.269 | 100.084 | 100.839 | 100.176 | 99.857 | 99.696 |
| 2024-02-19T10:00:00Z | 100.981 | 100.557 | 100.351 | 100.148 | 100.981 | 100.248 | 99.957 | 99.710 |
| 2024-02-19T12:00:00Z | 100.622 | 100.622 | 100.418 | 100.205 | 100.622 | 100.384 | 100.026 | 99.721 |
| 2024-02-19T14:00:00Z | 100.579 | 100.636 | 100.452 | 100.242 | 100.579 | 100.465 | 100.090 | 99.783 |
| 2024-02-19T16:00:00Z | 100.625 | 100.557 | 100.426 | 100.242 | 100.625 | 100.557 | 100.195 | 99.850 |
| 2024-02-19T18:00:00Z | 99.986 | 100.509 | 100.412 | 100.248 | 99.986 | 100.622 | 100.269 | 99.901 |
| 2024-02-19T20:00:00Z | 100.147 | 100.403 | 100.358 | 100.227 | 100.147 | 100.636 | 100.351 | 99.950 |
| 2024-02-19T22:00:00Z | 99.897 | 100.355 | 100.333 | 100.222 | 99.897 | 100.557 | 100.418 | 100.025 |
| 2024-02-20T00:00:00Z | 99.620 | 100.185 | 100.230 | 100.167 | 99.620 | 100.509 | 100.452 | 100.084 |
| 2024-02-20T02:00:00Z | 99.522 | 100.088 | 100.164 | 100.131 | 99.522 | 100.403 | 100.426 | 100.148 |
| 2024-02-20T04:00:00Z | 100.156 | 100.039 | 100.124 | 100.109 | 100.156 | 100.355 | 100.412 | 100.205 |
| 2024-02-20T06:00:00Z | 100.022 | 100.067 | 100.131 | 100.115 | 100.022 | 100.185 | 100.358 | 100.242 |
| 2024-02-20T08:00:00Z | 99.871 | 100.013 | 100.089 | 100.090 | 99.871 | 100.088 | 100.333 | 100.242 |
| 2024-02-20T10:00:00Z | 100.885 | 100.104 | 100.136 | 100.119 | 100.885 | 100.039 | 100.230 | 100.248 |
| 2024-02-20T12:00:00Z | 101.953 | 100.364 | 100.294 | 100.218 | 101.953 | 100.067 | 100.164 | 100.227 |
| 2024-02-20T14:00:00Z | 99.714 | 100.397 | 100.324 | 100.242 | 99.714 | 100.013 | 100.124 | 100.222 |
| 2024-02-20T16:00:00Z | 99.029 | 100.106 | 100.151 | 100.142 | 99.029 | 100.104 | 100.131 | 100.167 |
| 2024-02-20T18:00:00Z | 100.527 | 100.031 | 100.099 | 100.110 | 100.527 | 100.364 | 100.089 | 100.131 |
| 2024-02-20T20:00:00Z | 100.378 | 100.114 | 100.142 | 100.136 | 100.378 | 100.397 | 100.136 | 100.109 |
| 2024-02-20T22:00:00Z | 100.831 | 100.259 | 100.229 | 100.190 | 100.831 | 100.106 | 100.294 | 100.115 |
| 2024-02-21T00:00:00Z | 100.530 | 100.354 | 100.292 | 100.232 | 100.530 | 100.031 | 100.324 | 100.090 |
| 2024-02-21T02:00:00Z | 100.336 | 100.378 | 100.315 | 100.251 | 100.336 | 100.114 | 100.151 | 100.119 |
| 2024-02-21T04:00:00Z | 100.019 | 100.355 | 100.309 | 100.252 | 100.019 | 100.259 | 100.099 | 100.218 |
| 2024-02-21T06:00:00Z | 99.500 | 100.226 | 100.234 | 100.210 | 99.500 | 100.354 | 100.142 | 100.242 |
At the marked candle, the unshifted lips sit just above the teeth and jaw. The displaced lines beside that same candle do not have bullish order. The closing prices and smoothing lengths are identical. The lines use smoothed values from different earlier candles. Prices are indexed to 100 at the start of the excerpt.
This is why an Alligator backtest should state how it handles the shifts. A chart drawn with offsets and orders calculated from unshifted values can be causal, but its orders are testing the unshifted rule.
How to combine Alligator and fractals
An upward Williams fractal has a central high with two lower highs on either side. It is only confirmed after the second following candle closes. An arrow drawn back at the central candle can make the pattern look available earlier than it was. MetaTrader’s fractal definition also describes filtering fractal signals with the Alligator.
Our narrower confirmed-fractal rule waits for a fresh close above the most recently confirmed high, with that level above the teeth. The lips, teeth, and jaw must also be in bullish order, and the close must be above the lips. The baseline uses the same alignment and price condition without requiring the fractal breakout.
Both rules decide after the candle closes and request execution at the next open. A close-confirmed crossing differs from a buy-stop order filled during a candle. We also use strict five-candle highs: equal highs do not form a fractal in this script.
Across 57,600 matched comparisons, the fresh-fractal rule had a higher return than alignment alone in 37,157. It produced fewer executions in 57,600. The extra condition changes both which moves qualify and when a position can reopen. The majority of matched settings favored confirmation in 5 of eight samples; the return ranking changed across samples. These are paired historical settings sharing many prices and trades, not independent trials.
At the standard lengths in one matched comparison, the alignment rule produced 304 executions and +18.98% return. Requiring a fresh confirmed-fractal breakout produced 162 executions and +20.98%. That example is useful evidence about these rules; it does not make confirmation a universal improvement.
A confirmed level is not always a new breakout
Suppose price closes above a confirmed high, a position opens, and a later exit closes it. If the close remains above that same high, an above-level rule can permit another entry. A fresh-breakout rule waits for a close back to or below the level, then a close above it, or for a newer confirmed fractal to provide another crossing.
The averages, confirmed highs, and exits can be identical while the reentry timing differs. To separate that choice from confirmation itself, we added an above-level control after inspecting the first sweep.
The 57,600 additional configuration evaluations held the averages, shifts, and exits fixed while adding this above-level control. In the same standard-setting comparison, remaining above the confirmed level produced 210 executions, versus 162 for a fresh crossing. Their returns were +18.12% and +20.98% respectively.
The above-level gate improved on alignment alone in 38,718 of 57,600 matched pairs, with the majority favoring it in 6 of eight samples. Demanding a fresh crossing reduced executions further in every matched pair. It had a higher return than the above-level rule in 30,025 of 57,600 pairs, with the majority favoring it in 4 of eight samples.
Confirmation and freshness therefore answer different questions. The first filters price relative to a known level; the second restricts when another position may open. Neither return ranking held across all samples.
Which Alligator exit should you test?
We compared an exit when lips fall below teeth with an exit when the close falls below teeth. Both use the same entry conditions and sizing. The first asks whether two smoothed lines have reversed order. The second asks whether price has crossed a balance line.
For the same standard-length, displaced, fresh-fractal example, the line-cross exit produced 162 executions, +20.98% return, and 24.95% reported maximum drawdown. The price-below-teeth exit produced 186 executions, +15.40% return, and 20.84% drawdown.
The price exit reduced reported drawdown in this example and created more entries and exits, while return fell. Other samples changed the performance ranking. A rule that reacts earlier to price can interrupt a trend and permit another entry before the smoothed lines reverse.
Neither is a protective stop that guarantees a maximum loss. The tests use candle-close decisions and next-open execution; a gap can change the actual exit price.
Are the default settings the best settings?
The standard 5/8/13 lengths are a useful starting point because they make comparisons recognizable. An optimized replacement needs more evidence than a high-return row.
The display convention itself changed the result in opposite directions across historical samples. Here are two comparisons using the same 5/8/13 lengths, alignment entry, and lips-below-teeth exit:
| Matched example | No display shift | Chart-aligned shifts |
|---|---|---|
| Comparison 1 | -17.51% | +18.98% |
| Comparison 2 | -20.51% | -35.45% |
The shifted values improved the first comparison and worsened the second. The shift therefore belongs in the strategy definition, rather than being treated as an automatic upgrade. Exact sample mapping is in the methods.
The canonical shifted, fresh-fractal, line-exit rule finished positive in 6 of eight samples and above a passive control with the same startup, allocation, and entry cost in 4 of eight. A positive result and outperformance answer different questions. These historical comparisons establish neither a universally best setting nor future profitability. In Comparison 1, none of the 21,600 configurations exceeded the same-start passive return of +82.55%, including the settings that improved on alignment alone.
A slow jaw also does not guarantee a perfectly decreasing trade count. Changing its smoothing length can change which stretches have teeth above jaw. Existing positions and the unchanged exit then determine whether a new qualifying stretch produces another trade. In the alignment example below, increasing the jaw from 18 to 19 candles raises recorded executions from 290 to 294, with the lips, teeth, shifts, entry condition, and exit held fixed.
Changing the jaw length can change which trend stretches qualify. The exit remains unchanged.
The value table below is available without JavaScript.
Data and calculation details
Accessible value table (60 observations)
| Observation | Recorded executions by jaw smoothing length · Alignment entry | Recorded executions by jaw smoothing length · Fresh fractal breakout | Recorded executions by jaw smoothing length · Above confirmed level |
|---|---|---|---|
| 13 | 304.000 | 162.000 | 210.000 |
| 14 | 304.000 | 160.000 | 206.000 |
| 15 | 296.000 | 146.000 | 194.000 |
| 16 | 292.000 | 142.000 | 194.000 |
| 17 | 290.000 | 140.000 | 194.000 |
| 18 | 290.000 | 142.000 | 196.000 |
| 19 | 294.000 | 140.000 | 194.000 |
| 20 | 290.000 | 140.000 | 192.000 |
| 21 | 288.000 | 140.000 | 186.000 |
| 22 | 286.000 | 136.000 | 184.000 |
| 23 | 286.000 | 136.000 | 182.000 |
| 24 | 284.000 | 134.000 | 176.000 |
| 25 | 282.000 | 134.000 | 176.000 |
| 26 | 284.000 | 134.000 | 176.000 |
| 27 | 282.000 | 130.000 | 174.000 |
| 28 | 280.000 | 128.000 | 172.000 |
| 29 | 280.000 | 128.000 | 168.000 |
| 30 | 280.000 | 128.000 | 168.000 |
| 31 | 276.000 | 126.000 | 168.000 |
| 32 | 274.000 | 130.000 | 172.000 |
| 33 | 274.000 | 130.000 | 172.000 |
| 34 | 272.000 | 130.000 | 172.000 |
| 35 | 274.000 | 130.000 | 168.000 |
| 36 | 272.000 | 130.000 | 168.000 |
| 37 | 272.000 | 130.000 | 168.000 |
| 38 | 270.000 | 132.000 | 172.000 |
| 39 | 268.000 | 132.000 | 170.000 |
| 40 | 268.000 | 132.000 | 170.000 |
| 41 | 270.000 | 132.000 | 170.000 |
| 42 | 268.000 | 132.000 | 170.000 |
| 43 | 268.000 | 132.000 | 170.000 |
| 44 | 268.000 | 132.000 | 170.000 |
| 45 | 268.000 | 132.000 | 170.000 |
| 46 | 268.000 | 132.000 | 170.000 |
| 47 | 268.000 | 132.000 | 168.000 |
| 48 | 268.000 | 132.000 | 168.000 |
| 49 | 268.000 | 132.000 | 170.000 |
| 50 | 268.000 | 132.000 | 168.000 |
| 51 | 270.000 | 130.000 | 166.000 |
| 52 | 270.000 | 130.000 | 166.000 |
| 53 | 270.000 | 130.000 | 166.000 |
| 54 | 272.000 | 130.000 | 168.000 |
| 55 | 272.000 | 128.000 | 168.000 |
| 56 | 268.000 | 128.000 | 166.000 |
| 57 | 264.000 | 126.000 | 164.000 |
| 58 | 264.000 | 126.000 | 164.000 |
| 59 | 262.000 | 124.000 | 160.000 |
| 60 | 264.000 | 124.000 | 160.000 |
| 61 | 264.000 | 124.000 | 160.000 |
| 62 | 262.000 | 124.000 | 160.000 |
| 63 | 260.000 | 124.000 | 160.000 |
| 64 | 260.000 | 124.000 | 160.000 |
| 65 | 258.000 | 124.000 | 160.000 |
| 66 | 256.000 | 124.000 | 160.000 |
| 67 | 254.000 | 124.000 | 160.000 |
| 68 | 254.000 | 124.000 | 160.000 |
| 69 | 254.000 | 124.000 | 160.000 |
| 70 | 254.000 | 124.000 | 160.000 |
| 71 | 254.000 | 124.000 | 160.000 |
| 72 | 252.000 | 124.000 | 162.000 |
The chart counts recorded executions, with each buy or sell counted once. It is not a count of every bullish candle, and a quieter curve alone does not mean a better strategy.
How we checked the behavior
The study completed 172,800 configuration evaluations. The first 115,200 compared alignment and fresh-fractal entries, two displacement conventions, and two exits across smoothing settings. A separate 57,600-evaluation control then isolated remaining above a confirmed high from freshly crossing it. The same grids were repeated across the historical samples without finding a new best setting for each one.
Copy the strategy script
This tested version includes all three entry choices: 0 for alignment, 1 for a fresh confirmed-fractal crossing, and 2 for remaining above the confirmed level. It defaults to 2, the above-level control. Set the study’s combined trading cost to 0.1% per execution in your backtest settings.
//@version=6
strategy("Alligator causal rule lab v4: persistent-level control", overlay=true, initial_capital=10000, default_qty_type=strategy.percent_of_equity, default_qty_value=99, process_orders_on_close=false)

lips_length = input.int(5, "Lips smoothing", minval=2, maxval=7)
teeth_length = input.int(8, "Teeth smoothing", minval=8, maxval=12)
jaw_length = input.int(13, "Jaw smoothing", minval=13, maxval=72)
shift_mode = input.int(1, "Shift: 0 unshifted, 1 chart-aligned", minval=0, maxval=1)
entry_mode = input.int(2, "Entry: 0 alignment, 1 fresh fractal, 2 above fractal", minval=0, maxval=2)
exit_mode = input.int(0, "Exit: 0 lips below teeth, 1 close below teeth", minval=0, maxval=1)

lips_raw = ta.rma(hl2, lips_length)
teeth_raw = ta.rma(hl2, teeth_length)
jaw_raw = ta.rma(hl2, jaw_length)
lips = shift_mode == 0 ? lips_raw : lips_raw[3]
teeth = shift_mode == 0 ? teeth_raw : teeth_raw[5]
jaw = shift_mode == 0 ? jaw_raw : jaw_raw[8]
up_fractal = high[2] > high[4] and high[2] > high[3] and high[2] > high[1] and high[2] > high
var fractal_level = 0.0
if up_fractal
    fractal_level := high[2]
ready = bar_index >= 500 and not na(jaw)
alignment = lips > teeth and teeth > jaw
breakout = fractal_level > teeth and close > fractal_level and close[1] <= fractal_level
above_fractal = fractal_level > teeth and close > fractal_level
enter_long = ready and alignment and close > lips and (entry_mode == 0 or (entry_mode == 1 ? breakout : above_fractal))
exit_long = ready and (exit_mode == 0 ? lips < teeth : close < teeth)

plot(lips, "Lips at current chart coordinate", color=color.green)
plot(teeth, "Teeth at current chart coordinate", color=color.red)
plot(jaw, "Jaw at current chart coordinate", color=color.blue)
plot(fractal_level, "Last confirmed up-fractal high", color=color.orange)

if exit_long and strategy.position_size > 0
    strategy.close("Long")
if enter_long and strategy.position_size == 0
    strategy.entry("Long", strategy.long)
What we tested, and how to reproduce it
The study used Binance Spot BTCUSDT and ETHUSDT, two- and four-hour candles, and 2021-01-01–2023-12-31 plus 2024-01-01–2025-12-31. The eight datasets are related historical replications. The first completed sample was BTC 2h in the later window; it was inspected before the other results. Nothing here is an untouched prospective holdout.
Core grid per dataset: lips 2–7, teeth 8–12, and jaw 13–72, each in increments of one; shifts 0 or conventional 3/5/8; alignment or fresh-fractal entry; and line-cross or price-below-teeth exit. All 1,800 length triples have lips < teeth < jaw. This gives 14,400 configurations per dataset and 115,200 across eight. The lip and teeth ranges are deliberately narrower than the jaw range. Display shifts stay 3/5/8 when smoothing lengths vary.
The above-level control was frozen after inspecting the first core batch and before results from the second. Its 7,200 configurations per dataset keep the same length, shift, and exit grids, with only the persistent above-fractal entry rule. That adds 57,600 configurations, for 21,600 per dataset and 172,800 overall. Eight small fresh-rule repeats bridge the source versions: all returned fields match their original core rows exactly. These repeats are excluded from the evaluation total. The follow-up is exploratory historical research.
Every evaluation began with 10,000 USDT in cash, used no leverage, and budgeted 99% of equity per long entry, leaving 1% reserve for next-open price movement. The combined fee/slippage setting was 0.1% per execution. The first 500 bars stayed in cash; idle cash earned no yield. Decisions use completed candles, followed by next-open market execution. Any final open position is valued at the final close. Larger candles imply more elapsed startup time as well as a different averaging horizon.
All line comparisons use midpoint SMMAs seeded with an SMA. A fractal high is strictly greater than the highs of the two candles on each side, becomes available after the second following candle closes, and is replaced by the next confirmed high. The fresh rule compares the current and previous closes with that same latest level. The above-level rule needs only the current close beyond it. All entries also need bullish line order, close above lips, and a fractal level above teeth when that filter is active. These are close-confirmed tests, not stop-order fills through the fractal during a candle. Exits and entries cannot request orders on the same close.
The selected end date includes the candle opening at 00:00 UTC on that date, not the remainder of the day. Platform full-window buy-and-hold measures first-close to last-close price return before costs. Our separate passive controls buy after the same 500 startup bars using the same 99% allocation and entry cost, then hold. Their recorded returns are used below.
| Historical dataset | Canonical return | Canonical drawdown | Canonical executions | Fixed first-sweep winner return | Same-start passive |
|---|---|---|---|---|---|
| BTC · 2h · 2024–2025 | +20.98% | 24.95% | 162 | +51.14% | +82.55% |
| BTC · 4h · 2024–2025 | +10.33% | 16.57% | 76 | +10.53% | +34.90% |
| BTC · 2h · 2021–2023 | +7.00% | 47.81% | 216 | +63.41% | -10.95% |
| BTC · 4h · 2021–2023 | +35.06% | 24.71% | 96 | +14.74% | -19.03% |
| ETH · 2h · 2021–2023 | +37.71% | 41.99% | 244 | +2.74% | +28.11% |
| ETH · 4h · 2021–2023 | +75.91% | 35.50% | 112 | +33.18% | +42.85% |
| ETH · 2h · 2024–2025 | -17.76% | 54.62% | 152 | -11.67% | +18.37% |
| ETH · 4h · 2024–2025 | -17.41% | 49.51% | 68 | -25.22% | -12.26% |
Canonical settings here are 5/8/13, chart-aligned 3/5/8 shifts, fresh-fractal entry, and lips-below-teeth exit. The unchanged comparison row uses 7/11/19 with those same rules: it was selected as the strongest return in the first BTC 2h core sweep, then carried unchanged. It is an exploratory search winner, not an independently validated recommendation. Reported maximum drawdown belongs to the historical portfolio path, not a guaranteed loss limit.
Main-text Comparison 1 is BTC 2h 2024–2025; Comparison 2 is BTC 2h 2021–2023. The entry and exit examples use the first sample with canonical lengths and chart-aligned shifts. The visible jaw-activity chart uses that same first sample, lips 5, teeth 8, shifted lines, and lips-below-teeth exit; only jaw length and entry rule vary. The evidence download preserves complete curves for all eight samples. Each buy or sell is one execution, rather than a round trip.
Completed exports contain 172,800 unique traded rows and 0 reconciled valid zero-trade outcomes omitted from exports. Exact parameter tuples including candle size, all requested axes, completion totals, errors, duplicate conflicts, capital, benchmark values, and source/export SHA-256 hashes were checked. No accepted batch has an execution error or conflicting duplicate. 32 preparatory or repeated evaluations are excluded from the headline. The earlier compilation attempt executed no configurations.
A separate check compared all 162 recorded canonical shifted/fresh-fractal/line-exit executions from the first 2h sample with official checksum-verified candle opens and independently calculated preceding-close conditions. All 162 prices and conditions matched at UI display precision. This validates one setting’s recorded trace; it is not a local trading simulation or an exhaustive proof of every swept portfolio path.
The line-timing chart uses official Binance BTCUSDT 2h data. It selects the first post-startup transition to unshifted bullish order with close above unshifted lips while displaced line order is not bullish, at 2024-02-18 10:00 UTC. Values use the complete frame history for smoothing and are indexed to the first displayed close. Its candle provenance retains the exact timestamps, source archive names, checksums, prices, formulas, and selection rule. The chart illustrates indicator values and has no inferred execution markers.
Download the core Pine script, above-level control script, measurement and source evidence, and completed core batch screenshot. Original platform exports, diagnostic files, detailed audits, and completion screenshots remain in the research archive. Adjacent settings share many trades and samples share markets; these evaluations do not supply independent statistical proof of a live edge.
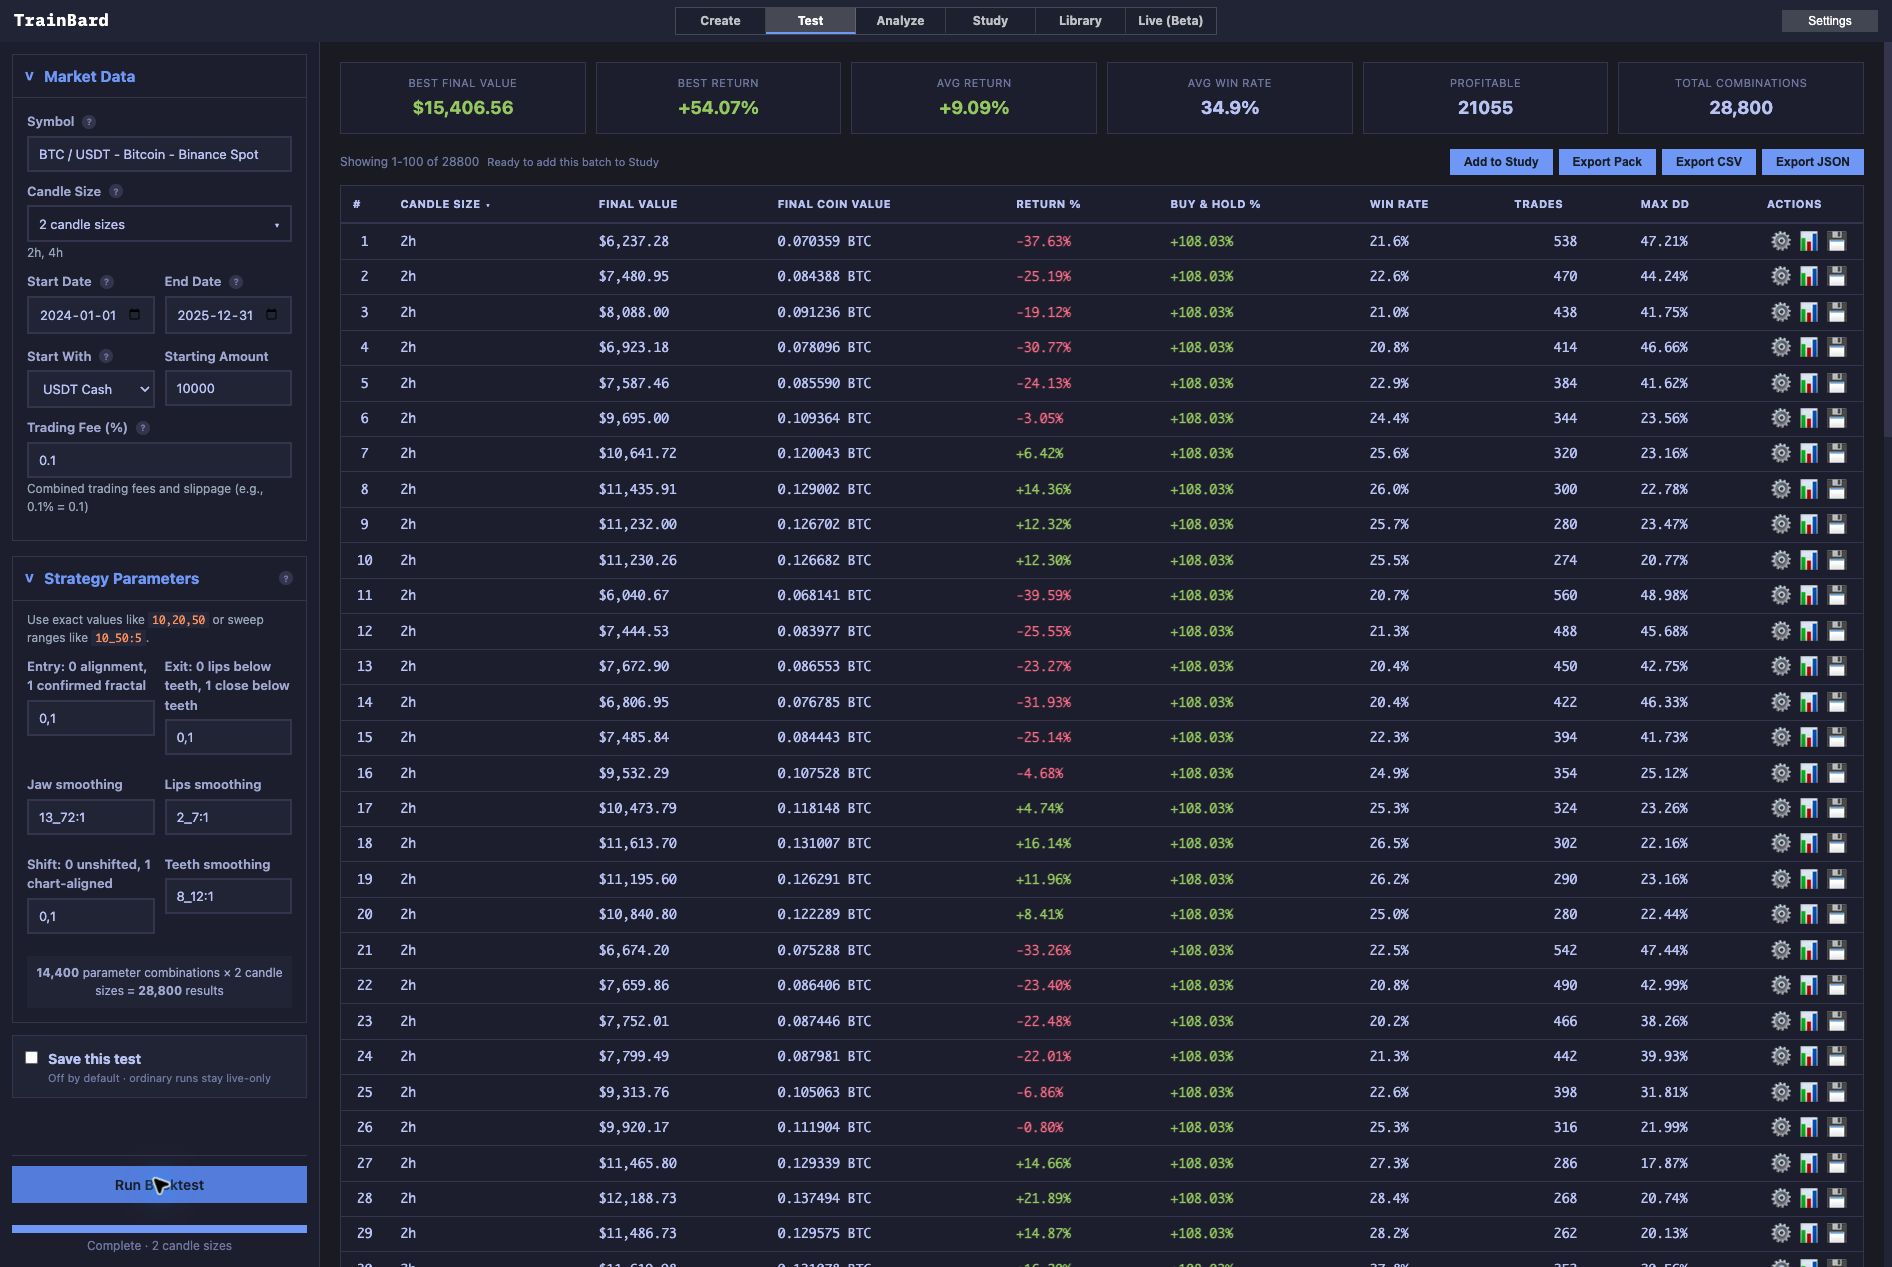

To test the same decisions, open TrainBard with the supplied script. Compare the shift convention first, hold the averages fixed while changing the entry or exit, and only then explore neighboring lengths.
Compare how confirmation interacts with exits in the Turtle channel strategy, or explore a trailing level whose settings can change trade timing in Parabolic SAR.